
Decision by Committee (January 12, 2023): Narrowing the duration gap Interest rates have moved markedly higher over the last 12 […]
While it is undeniably the case that the general mood in the market is less downbeat now than it has been in a while, sentiment continues to be restrained by significant concerns over the outlook.
Despite the global economy’s persistent resiliency and success in overcoming the numerous obstacles laid in its path over the last three years, the consensus among forecasters remains that a recession is the most likely outcome for the bulk of Developed Markets (DM) over the next year.
Recession risks remain
Consensus expected probability of recession in 12 months
(percent)
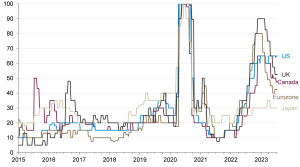
Source: Guardian Capital based on data from Bloomberg to July 28, 2023
The continuous upgrades to the near-term outlook over the last nine months that have been necessitated by persistently stronger-than-anticipated activity, have just been treated as delaying an imminent downturn. The weakness has just been kicked out to the end of this year.
Kicking the can down the road
Consensus real GDP growth forecast, G7
(quarter-over-quarter percent)
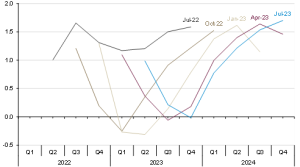
Series labels represent the date of consensus forecast, Jul-23 is as at July 28, 2023; G7=Canada, France, Germany, Italy, Japan, UK and US; source: Guardian Capital based on data from Bloomberg
These doubts about the health of the global economy and the durability of the current expansion are being echoed in sentiment surveys.
Measures of consumer and business confidence across DM show scant signs of elation. The aggregated gauges of sentiment for the 38-member countries of the Organisation for Economic Co-operation and Development1 (OECD) are depressed and at levels consistent with past recessions.
Feeling depressed
Consumer & business sentiment, OECD
(index; long-term average=100)
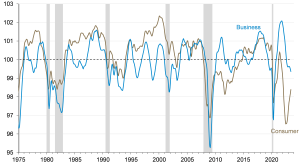
Shaded regions represent periods of US recession; source Guardian Capital based on data from the OECD and Bloomberg to June 2023
Waiting for the other shoe to drop
The main source for this looming sense of dread (driving the broadly-held view that a downturn is coming) is monetary policy.
The long and variable lags between central bank decisions and their impact on the real economy make calibrating the broad-reaching policy difficult.
Accordingly, policymakers have poor track records for getting inflation under control without choking off broader economic growth. Almost every recession in the post-World War II era has the fingerprints of monetary policy all over it (the exogenous shock of the pandemic being one of the few exceptions.)
Combine that with the fact that this tightening cycle has seen policy rates rise faster and further than any in recent history — central banks may take them higher still as they are not yet willing to declare victory over inflation — and with an unparalleled unanimity across the globe, and the assumption is that something ultimately will have to give.
Higher, Further, Faster
Central bank policy interest rates
(percent)
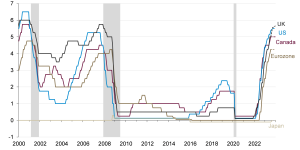
Shaded regions represent periods of US recession; dashed lines represent Bloomberg consensus forecasts as at July 28, 2023; source: Guardian Capital based on data from Bloomberg to July 28, 2023
The higher costs of carrying debt serve to restrain demand for credit, the lifeblood of the economy. At the same time, surveys indicate its supply is being constrained as lenders raise their standards for qualifying for loans in the name of protecting their books from the assumed looming downturn — the flare-up of financial system stress earlier this year also exacerbated concerns on this front as well.
Bank surveys in the US, Europe and Canada all point to a degree of tightening in standards that typically coincides with a recession.
Raising their standards
Balance of opinion on standards for business loans
(net percent of banks tightening versus easing)
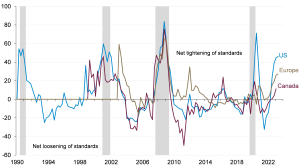
Shaded regions represent periods of US recession; source: Guardian Capital based on data from the US Federal Reserve, European Central Bank and Bank of Canada to Q2 2023
Echoing this tightening of financial conditions, the yield curve — the gap between long-term and short-term market interest rates — remains deeply inverted or in negative territory.
Given that banks traditionally borrow in the short term to finance longer-term loans, the curve is treated as a leading indicator of credit availability. A yield curve inversion has historically been a harbinger of a recession within the next two years (it first turned negative a year ago).
Curve your enthusiasm
Government of Canada yield curves
(basis points)
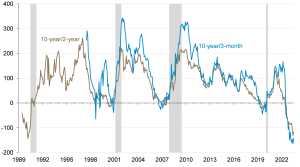
Shaded region represents periods of US recession; source: Guardian Capital based on data from Bloomberg to July 28, 2023
With all of this said, there are still reasons to believe that the proverbial “wall of worry” being built can continue to be scaled in the months ahead.
For starters, the fact that everybody is keenly aware of the risks to the outlook and proceeding with caution arguably lowers those risks — as well as the potential size of any fallout. The unexpected and inherently unpredictable shocks are the ones that tend to cause the most damage.
Secondly, aside from unexpected shocks (such as war, natural disasters, or a pandemic), economic downturns are the product of systemic imbalances.
These excesses arise from misallocations of capital during periods of ample liquidity and can persist until there is a reason for positions to unwind. Typically, it is a central-bank-induced jump in costs of capital that makes overextended financial positions untenable, with the larger the imbalance, the greater the unwind and resultant negative spillovers.
The persistent uncertainty over the economic outlook over the last three years has undoubtedly factored into preventing significant financial imbalances from developing simply because the constraints on activity limited the ability and willingness of households and businesses in the aggregate to overextend themselves.
The resultant underlying strength of consumer and corporate finances appears to be a reason behind the fairly limited fallout so far from the most aggressive tightening cycle in decades. There are no indications yet that of widespread difficulties in meeting financial obligations.
For businesses, the improved profitability and efforts over the last decade to take advantage of positive financing conditions to improve balance sheets have resulted in corporate finances being in good shape, with low leverage, extended maturities of debt and high-interest coverage providing flexibility to weather the challenges of the past three years.
This is a key reason why the surge in market interest rates over the last year has not caused material distress in credit markets as yet. Corporate bond default rates remain muted and credit spreads, while above recent lows, are not insinuating that the credit cycle will soon take a harsh turn.
Default Settings
High Yield bond par-weighted default rate & credit spreads
(percent) (basis points) (percent) (basis points)
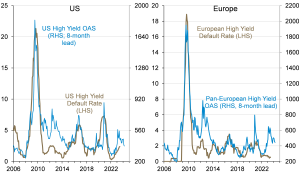
Shaded regions represent periods of US recession; source: Guardian Capital based on data from Bank of America Merrill Lynch to June 2023
On the consumer side, by some measures households now are the least debt-reliant in generations (more so in the US than Canada), while aggregate wealth is back within arms’ reach of all-time highs even with last year’s weakness in financial markets and the slump in housing prices.
Add to that the fact that consumers continue to sit on a pandemic-driven excess of savings — the US is the only G7 economy that has seen much of a drawdown to date, supporting better relative performance, but the well has not run dry.
Accordingly, households are still in good shape. Loan delinquencies remain benign, and while they are inching higher for credit cards, they remain at levels that are still below pre-pandemic norms.
Staying On Top Of Payments
Delinquent consumer loans at chartered banks, Canada
(percent of outstanding loans)
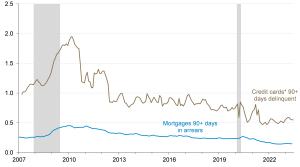
Shaded regions represent periods of US recession; source: Guardian Capital based on data from the Bloomberg and the Canadian Bankers’ Association to May 2023
This may well change in the coming years as ultra-low interest rate pandemic-era mortgages come up for renewal at higher costs. As of yet, however, there are limited signs of an impending wave of financially strapped homeowners being forced to put their homes on the market — and this lack of supply is putting a floor in the market and setting up the potential for a notable turnaround should buyers be coaxed back in by improved affordability.
Not For Sale
Supply Existing Single-Family Homes for Sale, Canada
(months to clear inventory at current sales rates)
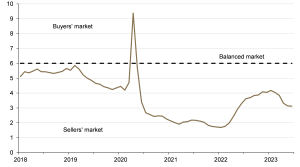
Source: Guardian Capital based on data from the Canadian Real Estate Association to June 2023
On that score, the prospect of further aggressive increases in interest rates looks to be limited as the major driver of policy concern appears to be abating.
High inflation, particularly on necessities such as food and energy, is a big headwind for activity as it means that consumers have to spend more on less.
And while rates of inflation remain above central banks’ comfort levels, the moderating trends are anticipated to be sustained in the months ahead.
The peak is in the past
Consumer price index2
(year-over-year percent change)
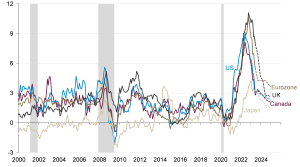
Shaded regions represent periods of US recession; dashed lines represent consensus forecasts as at July 28, 2023; source: Guardian Capital based on data from Bloomberg to June 2023
Looking at overall price gauges, the reversal of last year’s Russian-invasion-driven surge in agricultural and energy commodities has played a significant role in bringing inflation rates down to earth.
Commodity prices in the aggregate are 20% below year-ago levels, and barring a material shift higher in the coming months, will continue to exert downward pressure on inflation rates in the coming months.
No longer a hot commodity
S&P/Goldman Sachs spot commodity price index3
(year-over-year percent change)
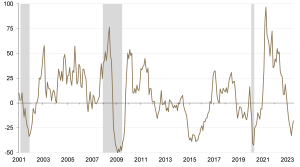
Shaded regions represent periods of US recession; source: Guardian Capital based on data from Bloomberg to June 2023
As well, while they may have proven to be less “transitory” than assumed, the pandemic-driven upward pressures on prices throughout supply chains are fading quickly.
Port congestion has been alleviated, order backlogs caught up, inventories replenished, and transportation and shipping costs have come back down to earth.
Aggregated gauges of supply-side pressures have returned to pre-pandemic levels.
Pressure release
Supply chain pressure index4, world
(standard deviations from the average)
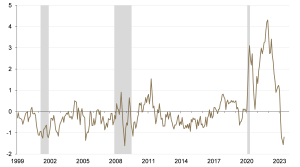
Shaded regions represent periods of US recession; source: Guardian Capital based on data from New York Federal Reserve Bank to March 2023
Against these positive developments, indicators of price pressures in the production pipeline have plunged worldwide — China, which is often the first step in the value chain, has seen producer prices decline particularly sharply relative to last year.
Plunging pipeline price pressure
Producer price index5
(year-over-year percent change)
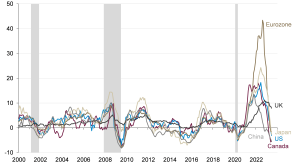
Shaded regions represent periods of US recession; source: Guardian Capital based on data from Bloomberg to June 2023
Add in the housing price drop — which only gets reflected in consumer price metrics with a sizable lag — and underlying inflation looks like they could well continue to moderate to more palatable, though likely still relatively elevated, levels by year-end.
Taking shelter
CPI shelter & national house prices6, Canada
(year-over-year percent change)
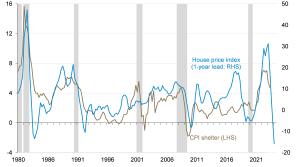
Shaded regions represent periods of US recession; source: Guardian Capital based on data from Bloomberg and the OECD to Q2 202
That said, any renewed verve in economic activity, particularly in services and housing, could have the impact of providing some offset to this desired progress — and the risk here is likely to keep central banks from pivoting soon.
The gap between the central bank guidance and financial market expectations has narrowed considerably over the last three months as concerns over a potential banking crisis came and went, and the left tails of the growth distribution got trimmed, that is, growth expectations were revised upwards.
The net result has been a general upward shift in market yields across the curve back toward the higher end of the ranges that have prevailed over the last year — notably for investors, though, the higher coupon to clip now has cushioned the impact.
There remains potential for some further upside pressure on rates, particularly at the front end of the curve, should central banks follow through with their more hawkish guidance — for example, the market is not convinced that the US Federal Reserve will add the further 25 basis points its June Summary of Economic Projections7 indicated.
With that said, there is little expectation rates will break out of their recent comfort zone. The consensus remains that 10-year sovereign yields will continue to effectively tread water for the foreseeable future around the last year’s ranges.
Rates remain rangebound
10-year sovereign bond yields & forecasts
(percent)
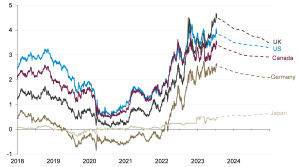
Source: Guardian Capital based on data from Bloomberg to July 28, 2023; dashed lines represent Bloomberg consensus forecasts as at July 28, 2023
A less volatile rate environment, combined with a continued moderate pace of economic expansion supporting earnings, easing inflation and limited further upside from central banks, would suggest that returns for bondholders in the near term are likely to echo their yields, which offer the best return prospects in over a decade — high-grade credit is particularly compelling in this regard, as are highly liquid and short-term Treasury bills that offer a notable premium given the shape of the curve.
ICE Bank of America bond index yields8, Canada
(percent)
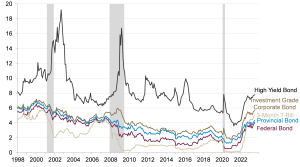
Shaded regions represent periods of US recession; source: Guardian Capital based on data from Bloomberg to July 28, 2023
Further, the now higher rates available on longer duration debt also provides opportunities from a risk management perspective for balanced portfolios as it increases their value as a diversifier.
The yield provides decent return prospects with limited valuation risk (i.e. there appears to be more scope for rates to decline over time than to rise further) while they also provide insurance against a marked deterioration in conditions that precipitates the pricing in of rate cuts, suggesting that the breakdown of the historically strong positive correlations between stocks and bonds seen last year should continue.
Finally breaking away
Stock* and bond** correlation, Global
(rolling 26-week correlation of returns)
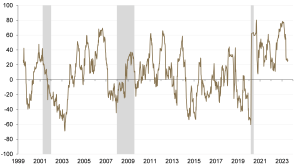
*Stocks=MSCI World Index9; **bonds=Bloomberg Global Aggregate Inde10,shaded regions represent periods of US recession; source: Guardian Capital based on data from Bloomberg to July 14, 2023
The global economy and financial markets have performed better than anticipated this year.
Rather than this underpinning a marked rise in optimism, however, focus remains on the downside risks to the outlook that keep the spectre of an economic downswing and consequent reversal of market momentum looming over the horizon.
While these risks clearly cannot be dismissed, it remains the case that the foundations that have underpinned growth over the last three years largely remain intact while the headwind of higher cost pressures is increasingly ebbing — which stands to ease pressure on policymakers to take interest rates higher — setting up the prospect of the global economy again surprising those waiting for the other shoe to drop.
This commentary is for general informational purposes only and does not constitute investment, financial, legal, accounting, tax advice or a recommendation to buy, sell or hold a security. It shall under no circumstances be considered an offer or solicitation to deal in any product or security mentioned herein. It is only intended for the audience to whom it has been distributed and may not be reproduced or redistributed without the consent of Guardian Capital LP. This information is not intended for distribution into any jurisdiction where such distribution is restricted by law or regulation.
The opinions expressed are as of the date of publication and are subject to change without notice. Assumptions, opinions and estimates are provided for illustrative purposes only and are subject to significant limitations. Reliance upon this information is at the sole discretion of the reader. The opinions expressed are as of the published date and are subject to change without notice. Assumptions, opinions and estimates are provided for illustrative purposes only and are subject to significant limitations. Reliance upon this information is at the sole discretion of the reader. This document includes information concerning financial markets that were developed at a particular point in time. This information is subject to change at any time, without notice and without update. This commentary may also include forward-looking statements concerning anticipated results, circumstances, and expectations regarding future events. Forward-looking statements require assumptions to be made and are, therefore, subject to inherent risks and uncertainties. There is a significant risk that predictions and other forward-looking statements will not prove to be accurate. Investing involves risk. Equity markets are volatile and will increase and decrease in response to economic, political, regulatory and other developments. Investments in foreign securities involve certain risks that differ from the risks of investing in domestic securities. Adverse political, economic, social or other conditions in a foreign country may make the stocks of that country difficult or impossible to sell. It is more difficult to obtain reliable information about some foreign securities. The costs of investing in some foreign markets may be higher than investing in domestic markets. Investments in foreign securities also are subject to currency fluctuations. The risks and potential rewards are usually greater for small companies and companies located in emerging markets. Bond markets and fixed-income securities are sensitive to interest rate movements. Inflation, credit and default risks are all associated with fixed income securities. Diversification may not protect against market risk and loss of principal may result. Index returns are for information purposes only and do not represent actual strategy or fund performance. Index performance returns do not reflect the impact of management fees, transaction costs or expenses. Certain information contained in this document has been obtained from external parties, which we believe to be reliable; however, we cannot guarantee its accuracy.
Guardian Capital LP manages portfolios for defined benefit and defined contribution pension plans, insurance companies, foundations, endowments and investment funds. Guardian Capital LP is a wholly owned subsidiary of Guardian Capital Group Limited, a publicly traded firm listed on the Toronto Stock Exchange. For further information on Guardian Capital LP, please visit www.guardiancapital.com. All trademarks, registered and unregistered, are owned by Guardian Capital Group Limited and are used under license.
Published: August, 2023