
Asset Mix Committee (Jan 12, 2023)
Decision by Committee (January 12, 2023): Narrowing the duration gap Interest rates have moved markedly higher over the last 12 […]
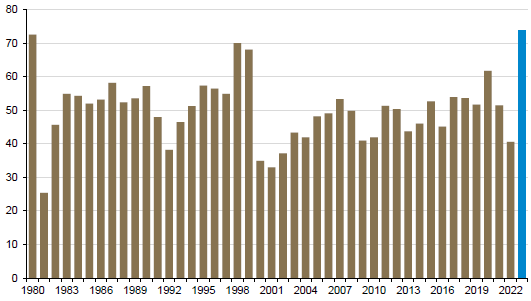
With it all now said and done, last year’s financial market performance will hardly garner much attention in future economists’ superficial review.
After all, while the 24% annual total return for the MSCI World Index1 represented a top quartile return for the last half-century, it was hardly an anomaly. The Developed Market (DM) equity benchmark has historically recorded gains in excess of 20% about one-third of the time (17 of the previous 50 years).
As well, the 6% return for the bond market (proxied by the ICE Bank of America US Corporate & Government Bond Index2) was almost bang on the average (and median) gain over the same period.
In this sense, 2023 marked a return to “normal” following the historical outlier that was 2022.
Chart 1: Nothing special
Annual equity and bond market total return
(percent; US dollar basis)
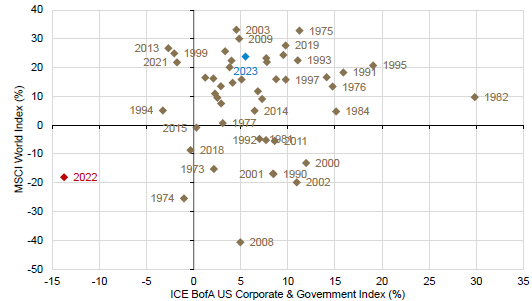
Source: Guardian Capital using data from Bloomberg from 1973 to 2023
Of course, the past 12 months have been anything but “run of the mill” for markets. Instead, it was highly eventful year that was marked with a series of “next big crises.”
First, there was the broad expectation that an economic shock was imminent. The Survey of Professional Forecasters3 from the Federal Reserve Bank of Philadelphia showed that the experts assigned the highest probability of a recession stateside in the study’s long history, while the market’s consensus base case for the year ahead was a broad downturn across DM.
Chart 2: Expecting the worst
Estimated probability recession in the next year, US
(percent)
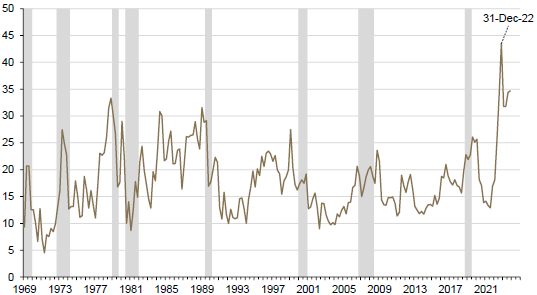
Shaded regions represent periods of US recession; source: Guardian Capital based on data from Federal Reserve Bank of Philadelphia’s Survey of Professional Forecasters3 to Q4 2023
As the dataflow showed continued resilience, and with China abandoning its “COVID Zero” policy, that concern was replaced by fears of demand-driven inflation triggering more aggressive actions by central banks. US Federal Reserve (Fed) governor Jerome Powell even stated4 in early March 2023, that policymakers at America’s central bank “would be prepared to increase the pace of rate hikes.”
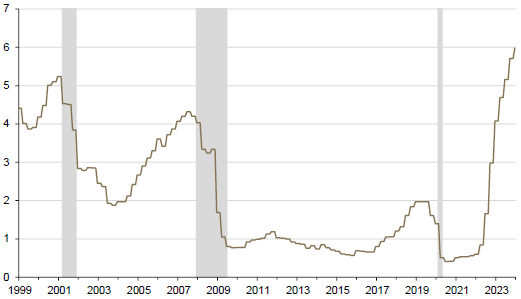
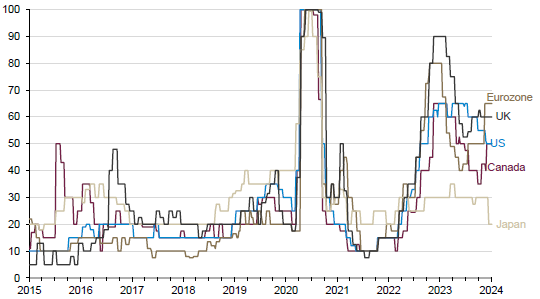
Before having the opportunity to act on that hawkish bias, however, three regional US banks collapsed, raising the specter of crises past and stoking fears of broader global financial system contagion that led to a merger of two large Swiss financial institutions.
The failures proved more idiosyncratic than systemic, which, combined with regulators’ actions, quelled financial stability concerns. Fearful lenders, however, markedly tightened standards in response.
Chart 3: Holding to a higher standard
Balance of opinion on standards for business loans
(net percent of banks tightening versus easing)
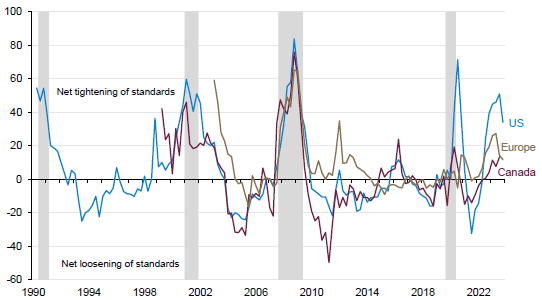
Shaded regions represent periods of US recession; source: Guardian Capital using data from the US Federal Reserve, European Central Bank and Bank of Canada to Q4 2023
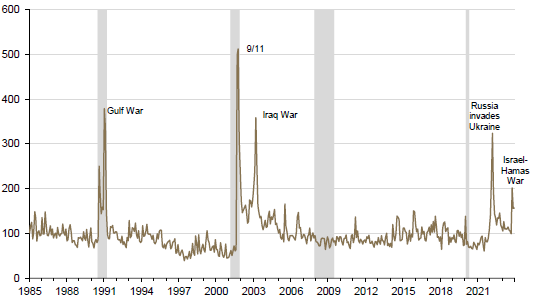
Focus then shifted to the renewed debate over the debt ceiling in the US that again threatened an American debt default — and resulted in another credit rating downgrade. As implied by credit default swaps, the risk of the US government failing to make payment on its Treasury debt far exceeded previous debt ceiling crises in 2011, 2013 and 2015.
Chart 4: Losing by default?
1-year credit default swap premium, US
(basis points)
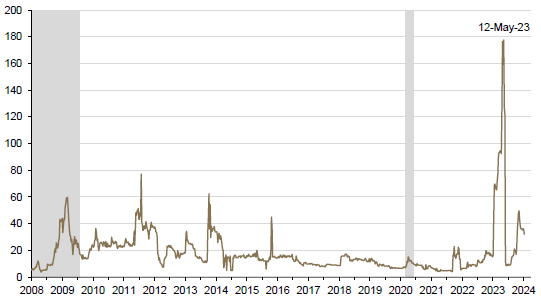
Shaded regions represent periods of US recession; source: Guardian Capital based on data from Bloomberg to January 12, 2024
Just as in these previous instances, however, the crisis was averted with a last-minute deal that again serves to kick the can down the road — the debt ceiling is currently suspended until January 1, 2025.
While these machinations roiled financial markets and factored into a softening in measures of consumer, business and investor sentiment, there were scant signs of impact on the real economy.
Growth momentum, instead, remained surprisingly well entrenched into the summer and with inflation still running well above comfort levels, central bankers continued to tighten policy.
Short-term interest rates across DM moved to their highest levels since the turn of the millennium and markets came around to the idea that they would stay “higher for longer,” spurring a re-rating that saw longer-term market yields hit their highest levels in a decade-and-a-half.
Chart 5: Rapidly scaling new heights
Policy interest rates, Developed Markets*
(percent)
*GDP-weighted average central bank policy interest rate; shaded regions represent periods of US recession; source: Guardian Capital using data from Bloomberg and the OECD5 to December 2023
Higher rates in conjunction with concerns over the health of China’s economy and a renewed pickup of geopolitical tensions following Hamas’ attack on Israel in October (and the ensuing war) weighed on financial markets into the fall, with equities ultimately declining for three consecutive months for the first time since the onset of the pandemic (which, of course, still lingers in the background).
Chart 6: Geopolitical instability
Geopolitical risk index6, World
(index; pre-2019 average=100)
Shaded regions represent periods of US recession; source: Guardian Capital using data from PolicyUncertainy.com7 to January 12, 2024
As of the end of October, global stock markets remained more than 10% below their peaks and with the exception of the US (and by extension the broader MSCI World Index and MSCI All Country
World Index8) were tracking for an effectively flat year — and the outperformance by American equities was due to historically narrow market leadership that offset largely unchanged performance elsewhere.
Chart 7: Results may vary
Year-to-date price performance, S&P 5009
(percent)
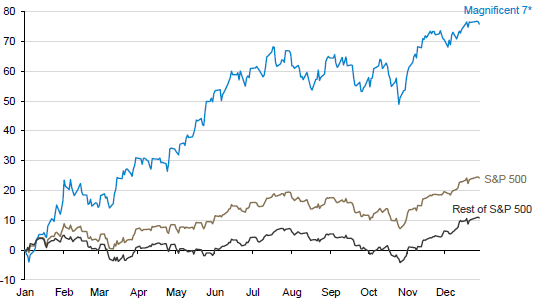
*”Magnificent 7”=Alphabet, Amazon, Apple, Meta, Microsoft, NVIDIA, and Tesla; source: Guardian Capital using data from Bloomberg to December 31, 2023
For their part, bonds were on pace for a record-setting third consecutive year of declines.
From there, though, all it took to get to “normal” was two abnormally strong months across markets.
Signs of moderating underlying inflation amid further indications of a desired rebalancing of supply and demand saw central banks soften their tone and increasingly move to the sidelines — something that was punctuated in December by the Fed projecting a lower path for policy rates and noting that discussions had begun on the when it would be appropriate to start reversing course.
Chart 8: Hold my calls
Central bank policy rate direction, G20
(three-month rolling percent of G20 central banks)
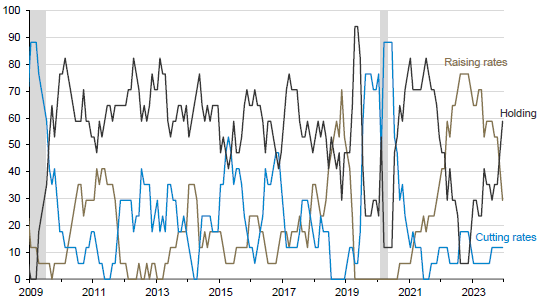
Shaded regions represent periods of US recession; source: Guardian Capital using data from Bloomberg and the Bank for International Settlements10 to December 31, 2023
The resultant decline in market rates, combined with further signs that growth momentum continued to hold up, fueled an outsized cross-asset rally.
Stocks rose broadly, with the global benchmark posting its best two-month stretch in three years while the aggregated global bond market turned in its best two months in 15 years (and third best two-month period in the last four decades).
Chart 9: Finishing strong
Equity and bond market total return, 2023
(percent; US dollar basis)
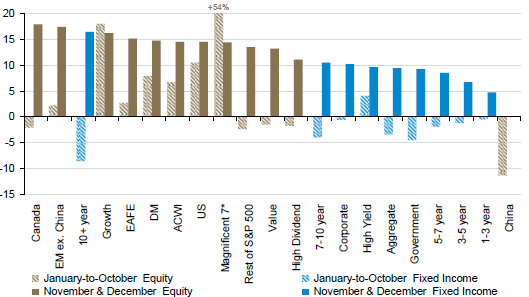
*”Magnificent 7”=Alphabet, Amazon, Apple, Meta, Microsoft, NVIDIA, and Tesla; indexes are global in coverage unless otherwise noted; equity indexes are MSCI Indexes11; bond indexes are Bloomberg bond indexes12; source: Guardian Capital using data from Bloomberg to December 31, 2023
In the end, 2023 was yet another example of how assuming something is a foregone conclusion can be a risky proposition for investors. As New York Yankee great Yogi Berra famously said, “It ain’t over ‘til it’s over.”
The New Year has a long way to go before it is over and it will undoubtedly be chock full of surprises, with new and unexpected developments causing a rethink of best-laid plans for the road ahead.
At the same time, it is arguable that there is more clarity over what is to come than there has been in recent years. The backdrop remains highly uncertain, but it appears to be less so than at any point since the pandemic began in early 2020.
For starters, the factors that have underpinned the surprising resiliency of the economy over the last three years broadly remain in place.
Consumers remain in relatively good shape in general, and especially for this stage of the cycle.
While the pandemic-accrued “excess” cash stockpiles are being drawn down — Europe and Canada, where savings rates remain above pre- COVID levels, the exceptions; this speaks to the degree of underperformance of these regions — it remains the case that households still have ample cash buffers with which to work.
Chart 10: Plenty of cash on hand
Excess* personal savings since 2020
(percent of nominal GDP)
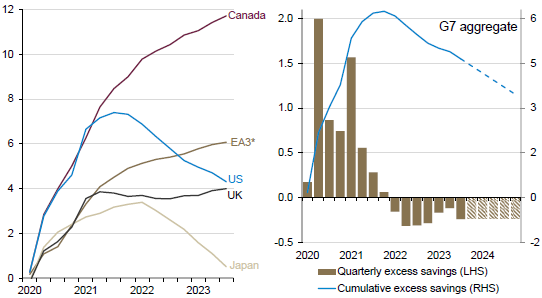
*EA3=France, Germany & Italy; **personal savings in excess of 1999 to 2019 trends; dashed line represents if spending continues at recent trend rates; source: Guardian Capital using data from the OECD, IMF13 and Bloomberg to Q3 2023
The recent recovery in financial markets, along with indications of stabilization in residential real estate markets (albeit at low levels of activity) as rates have come off their peaks, has only reinforced what were already solid balance sheets.
Chart 11: Housing building a foundation
House prices
(index; 2015 = 100)
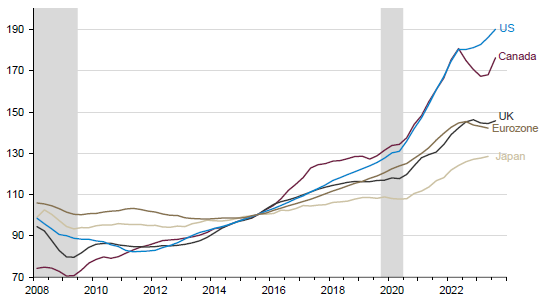
Shaded regions represent periods of US recession; source: Guardian Capital using data from the OECD to Q3 2023
As well, though it may be the case that hiring is slowing from its earlier robust pace and job vacancy rates are trending lower from historically elevated levels, it still appears that firms are retaining staff, no doubt in part a reaction to the difficulties in adding to headcounts in recent years.
Layoffs are limited and unemployment rates continue to sit at or near historical lows across the globe — the recent increases in the US and Canada are entirely due a surge in population growth in North America rather than any indication of widespread job losses.
Chart 12: A worker’s job market
Unemployment rates
(percent)
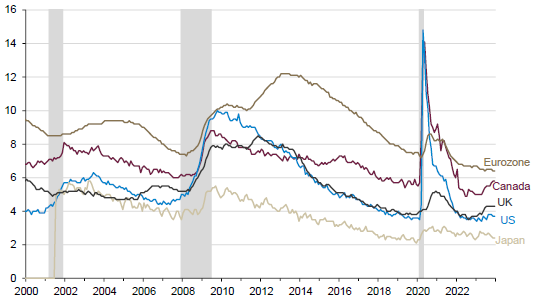
Shaded regions represent periods of US recession; source: Guardian Capital using data from Bloomberg to December 2023
The still firm job markets mean that household cash flows are complementing the stocks of savings and wealth, supporting ongoing consumer spending (which continues to rebalance back to services).
As well, the solid general financial position is keeping households on top of their financial obligations despite the added cost pressures of high inflation and interest rates.
To this point, only delinquency rates on high interest credit cards have moved materially from their postpandemic lows (though still not out of line with historical norms) while mortgage defaults remain historically low — the resumption of student loan payments in the US following a prolonged hiatus will likely become more noticeable in the newer vintages of these data.
Chart 13: Meeting obligations
Percent of loans 90+ days deliquent by type14, US
(percent of outstanding loan balances)
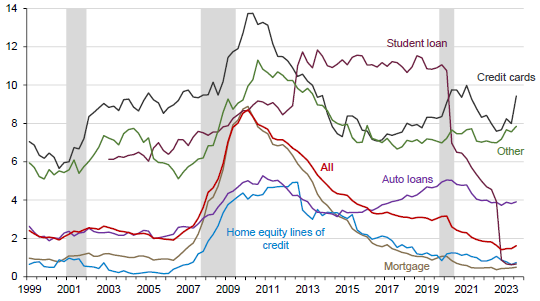
Shaded regions represent periods of US recession; source: Guardian Capital using data from the Federal Reserve Bank of New York15 to Q3 2023
Again, recent difficulties trying to hire may factor into businesses being hesitant to cut payrolls, but another key driver in the broad firmness in job markets is that demand remains decent.
For sure, global growth momentum has moderated from the earlier robust “reopening” boom, but the ebbing cost pressures in recent months have supported activity — in fact, there are actually signs of a modest pickup as the New Year begins.
The aggregated global purchasing managers’ index (PMI)16 shows goods’ producers’ activity has found a floor in recent months while business has improved for service providers as indicated by the gauges for both DM and Emerging Markets (EM) ending 2023 at five-month highs.
Given that services account for the vast majority of economic activity worldwide, the global composite PMI correspondingly has perked up and hit a five-month high as the calendar rolled over.
Chart 14: Maintaining momentum
Purchasing managers’ indexes16, World
(diffusion index; >50 denotes expansion)
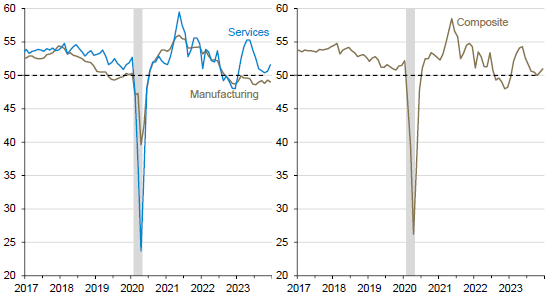
Shaded regions represent periods of US recession; source: Guardian Capital using data from Bloomberg to December 2023
Similarly, the slate of forward-looking indicators points to momentum broadly maintaining its modest upward trajectory, albeit with varying degrees of verve across regions and at generally at below-trend rates.
Chart 15: Follow the leader
Composite leading economic indicator17
(index; trend-growth = 100)
Shaded region represents a period of US recession; source: Guardian Capital using data from the OECD and Bloomberg to December 2023
These positive signposts combined with the general strength of corporate balance sheets, previous government initiatives, and a desire to diversify and reinforce supply chains have encouraged businesses to move forward with investments that have largely been restrained in recent years despite the higher prevailing costs of capital.
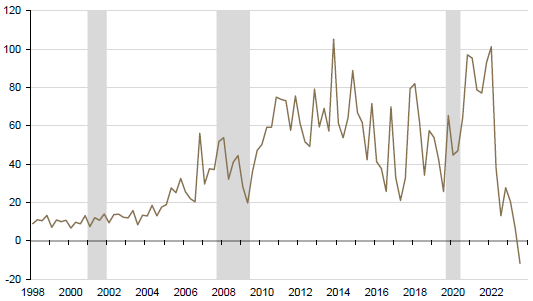
Nonresidential construction has been rising in the US of late with particular strength in factory building, especially for computer, electronics, and electrical goods. Investment here has more than doubled since the end of 2021 following the introduction of the Infrastructure Investment and Jobs Act (IIJA), Inflation Reduction Act (IRA), and the Creating Helpful Incentives to Produce Semiconductors and Science (CHIPS) Act.
Chart 16: Adding capacity
Real* nonresidential construction spending, US
(index; 2021 = 100)
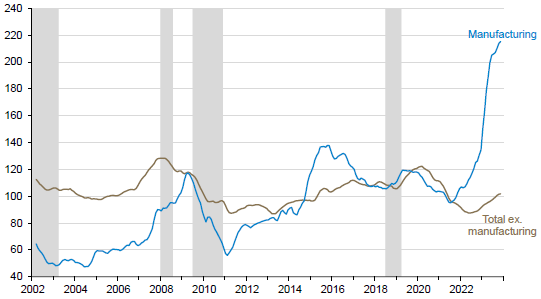
*Nominal spending deflated by producer price index for construction components & materials18; shaded regions represent periods of US recession; source: Guardian Capital using data from Bloomberg to November 2023
These gains have come at the expense of China, where net foreign direct investment turned negative (more spending abroad than inflows) for the first time on record for data back to 1998 as companies look to spread production to other markets.
Chart 17: Losing foreign investors
Net foreign direct investment in China
(billions of US dollars)
Shaded regions represent periods of US recession; source: Guardian Capital using data from China’s State Administration of Foreign Exchange to Q3 2023
Looking forward, reshoring and “friend-shoring” activity is likely to continue, but the main focus of business investment appears to be shifting toward less tangible things.
Developments in artificial intelligence offer the hope for revolutionary innovations that could spur a longer-term productivity boom across industries.
Those countries that are already heavily investing in research & development — largely skewed toward DM — stand to be best positioned to reap the benefits of these knowledge-intensive technologies.
Chart 18: Research for development
Spending on research & development, G20
(percent of gross domestic product)
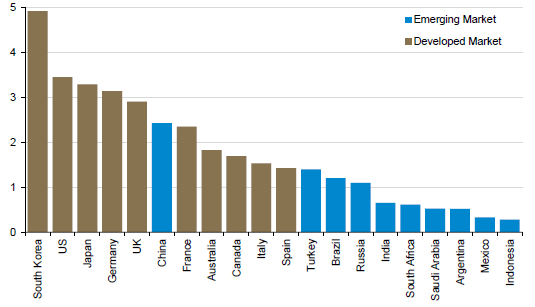
Source: Guardian Capital using data from the OECD and World Bank for 2022 or latest year available
Perhaps more importantly for the near-term outlook, though, is that the major macroeconomic risks that dampened expectations are subsiding — obviously notwithstanding that geopolitical tensions remain on a simmer and wars are now being fought on several fronts that may well expand and intensify.
While still elevated, inflationary pressures have moderated back within the realm of “normal” as the supply-side rifts of the pandemic fade, the commodity price shocks caused by the war in Ukraine dwindle, and the impact of the aggressive and globally synchronized monetary policy tightening temper demand.
The recent slate of data and forward-looking indicators suggest the downward trend in inflation will continue, with the gauges expected to drift near central bank targets by year-end.
Chart 19: Going down
Consumer price index19
(year-over-year percent change)
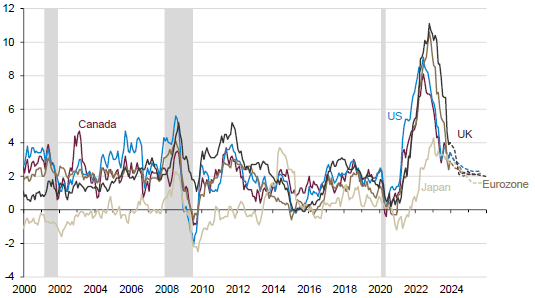
Dashed lines represent consensus forecasts as at January 12, 2024; shaded regions represent periods of US recession; source: Guardian Capital using data from Bloomberg to December 2023
In turn, the broad progress in restoring price stability has eased pressure on central bankers to tighten the screws further. The likes of the Fed, the Bank of Canada, European Central Bank and Bank of England have all held rates steady in recent months, and the tone of the rhetoric has softened notably.
While one can never say never, it appears that the peak in rates has passed as policymaker attention turns toward moving from “restrictive” back to “neutral” as they attempt to navigate a “soft landing”.
As it stands, the next move of virtually every global central bank is expected to be a cut (Japan essentially the only exception among DM).
Chart 20: Downshifting to neutral
Central bank policy interest rates
(percent)
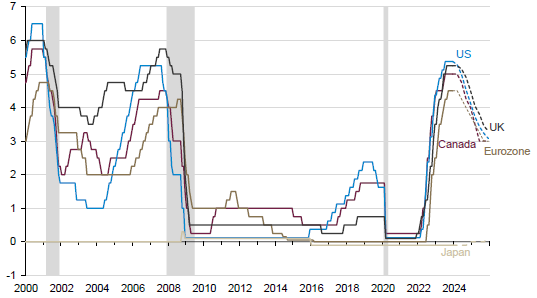
Dashed lines represent overnight index swap (OIS) implied rates as at January 12, 2024; shaded regions represent periods of US recession; source: Guardian Capital using data from Bloomberg to December 2023
Against this, market expectations that were almost uniformly looking for a material downturn at this point last year have come around to a more sanguine outlook of low but positive growth, moderating inflation and lower interest rates — this supported the broadening risk rally seen over the last nine weeks of 2023.
Chart 21: Landing softly
Growth and inflation forecasts
(percent; US dollar basis)
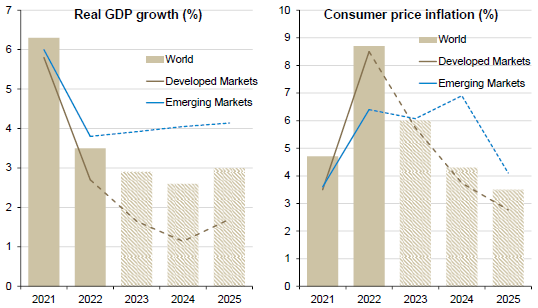
Dashed lines represent Bloomberg consensus forecasts as at January 12, 2024; source: Guardian Capital using data from Bloomberg
This backdrop would appear to be positive for continued financial market performance in the months to come, but unfortunately nothing is certain and plenty of risks remain.
For example, there is reason for caution in assuming central banks are fully done with their hiking cycles until they actually start to cut — and until that point, markets will likely be prone to knee-jerk reactions to the dataflow and officials’ comments.
Further to this, markets have priced in aggressive action for the year ahead that could be disappointed.
As it stands, markets are expecting (as per fed funds futures, overnight index swaps or consensus forecasts) that the Fed will cut policy rates this year by twice the amount penciled into the December Summary of Economic Projections20’ “dot plot.”
Chart 22: Lowered expectations
Expected Fed funds target interest rate
(percent)
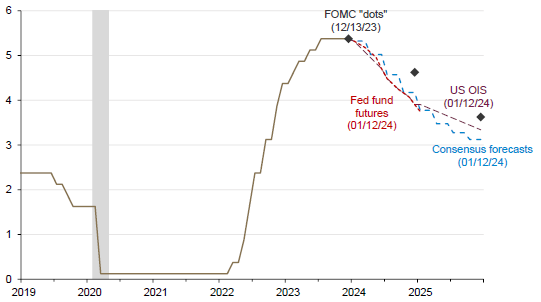
Shaded region represents period of US recession source: Guardian Capital using data from the US Federal Reserve Board and Bloomberg as at January 12, 2024
This suggests that there may be some vulnerability in the months ahead should there be signs that central banks may not be compelled to be proactive in moving policy back toward “neutral” settings.
And on that score, the fact that overall financial conditions have eased notably in the last few months could reduce impetus to begin backtracking, particularly in the US — the more restrictive conditions in Europe, if sustained, could be a key factor in differentiating regional economic performance for the year ahead.
Chart 23: Conditions have changed
Financial conditions index21
(index; 100=long-term average)
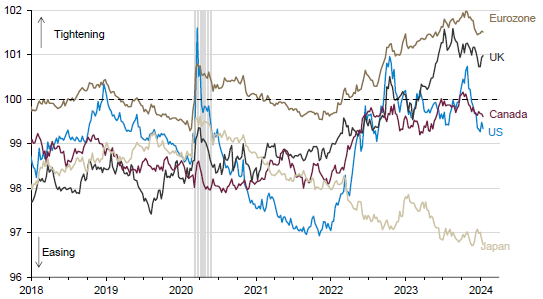
Shaded region represents period of US recession; source: Guardian Capital using data from Bloomberg to January 12, 2024
As well, after a quiet year for elections, that saw no major G7 votes for the first time since 1999, there is a busy slate for 2024 including in Taiwan (January), Indonesia (February), South Korea (April) India (April or May), South Africa (likely May), Mexico (June) and, most notably, the US (November), with the European Parliament too (June).
Chart 24: Back to politics as usual
Countries with general or legislative elections, G20
(number)
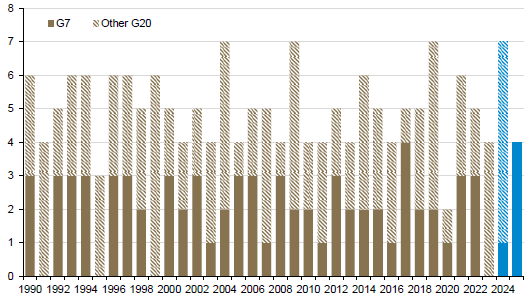
Assumes elections held on last possible day; source: Guardian Capital using data from Varieties of Democracy22 and the National Democratic Institute23 as at January 12, 2024
Election cycles tend to coincide with upticks in government spending as incumbents look to soften up prospective voters.
Whether prudent or not, this could mean a smaller near-term drag from otherwise increasing fiscal restraint as countries seek to rein in structural deficits and pare significant debt loads — both of these, however, will constrain capacity to spend, while the US’ ongoing budgetary morass could see government shutdown even before the debt ceiling debate resurfaces at year-end.
Chart 25: Fiscally unfit
General government fiscal balance
(percent of gross domestic product)
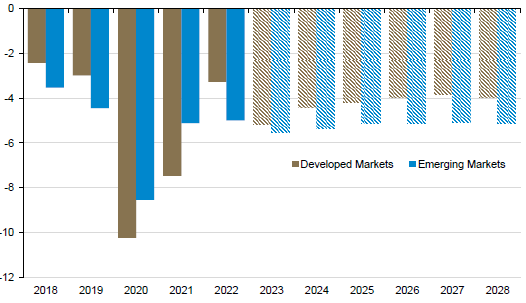
Forecasts are from the International Monetary Fund’s October 2023 World Economic Outlook24; source: Guardian Capital using data from the IMF
Less positively, though, there is no such thing as a “routine” election outside of more authoritarian-leaning regimes (Russia’s election is slated for March, as an aside), which points to potential for uncertainty-driven volatility — this is especially likely given that the vote in the US may have lasting implications for the geopolitical backdrop.
Elsewhere, geopolitics remain prominent on the risk radar as wars continue on a couple of fronts.
While the global spillovers from the ongoing conflict in Ukraine have lessened, there are rising pressures being felt in the Middle East even as the core struggle at the moment has remained contained.
Most notably, disruptions in the Red Sea have driven a recent spike in shipping costs — and given that roughly one-third of global container traffic and 10% of oil and gas shipments flow through the Suez Canal, the potential impacts could compound and result in greater costs through the supply chain.
Chart 26: Shipping strains
Container shipping costs, World
(thousands of US dollars per 40-foot container)
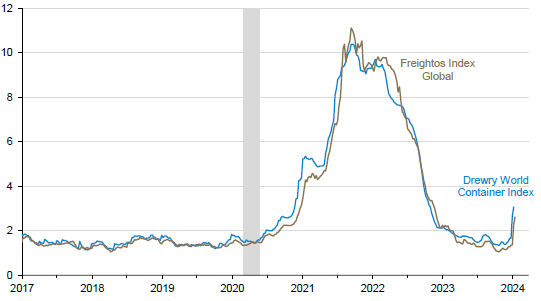
Shaded region represents period of US recession; source: Guardian Capital using data from Bloomberg to January 12, 2024
Finally, while the outlook has improved, broad gauges of consumer and business sentiment remain highly depressed. This creates the prospect of a negative and self-fulfilling cycle, should the subdued enthusiasm over the current environment filter into spending and investing behaviour. That said, a lack of congruence between what people and businesses are saying and what they are doing has been a trademark of current cycle.
Chart 27: Sentiment still sagging
Consumer & business sentiment, OECD
(index; long-term average=100)
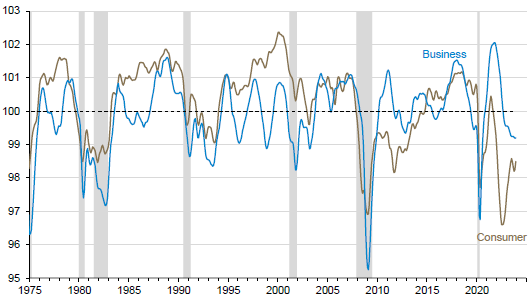
Shaded regions represent periods of US recession; source Guardian Capital using data from the OECD and Bloomberg to December 2023
Many in the professional forecasting community are living up to their nicknames as “dismal scientists” as well, maintaining their calls that a recession remains imminent — the argument being a downturn has just been delayed and not avoided.
The consensus is still assigning slightly better-than-even odds of a material economic slowdown in the coming year, and though there is less conviction in this prognostication than prevailed at this time last year, it does serve to emphasize that the outlook is anything but completely clear.
Chart 28: Keeping the (lack of) faith
Consensus expected probability of recession in 12 months
(percent)
Source: Guardian Capital using data from Bloomberg to January 12, 2024
A base case outlook of moderating inflation, lower interest rates and low but positive economic growth worldwide would appear to be constructive for risk asset performance going forward.
The outsized moves across asset classes seen over the last two months, however, suggests that gains are likely to be comparatively muted relative to what otherwise could have been. The likelihood of a repeat of 2023’s strong final tallies has declined.
As well, the speed and magnitude of the moves opens up the possibility that markets have gotten ahead of themselves and may therefore result in some near-term consolidation and related volatility.
This is particularly the case in fixed income markets, where recent performance has swung from a negative outlier to a positive one.
As mentioned, the strong bond returns through the end of 2023 were fueled by progress with respect to achieving central bank price stability goals driving a significant reappraisal of the path for policy rates.
Inflation, however, remains well above central banks’ comfort levels and inflation expectations, while off their peaks, are still elevated relative to prepandemic levels.
Chart 29: Inflated expectations
10-year break-even25 inflation rates
(percent)
Shaded region represents period of US recession; source Guardian Capital using data from the Bloomberg to January 12, 2024
Combine that with the indications of sustained economic momentum and there is little to suggest that global central banks will be compelled to move aggressively and soon.
So, while it looks likely that the path of least resistance for interest rates in the year ahead ultimately is lower, as central banks begin to ease away from their restrictive policy stances, there is upside risk in the near-term should markets again have to re-adjust their expectations.
That said, there is a limit on the degree of upside barring a material break higher in inflation that spurs further action from policymakers. Absent that, the peak in rates has likely passed and rates are likely to remain within recent trading ranges.
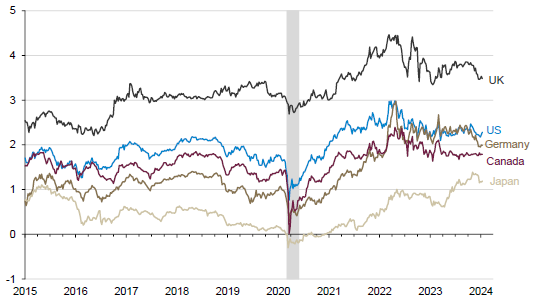
Chart 30: Range-bound rates
10-year sovereign bond yield
(percent)
Dashed lines represent consensus forecasts as at January 12, 2024; shaded regions represent periods of US recession; source: Guardian Capital using data from Bloomberg to January 12, 2024
Accordingly, though there may be some ongoing volatility; that yields remain near their highest levels in more than a decade, and are expected to trend lower, would suggest that the return prospects on bonds are the best they have been in a long while.
Corporate bonds appear particularly attractive in this context as the comparably higher coupons available on these debt issues points to higher relative returns, which could be compounded by a narrowing in spreads — high-grade credit appears to offer more scope from improvement on this front.
Chart 31: Spread ’em
Credit spreads over government bond yields, World*
(basis points)
*Bloomberg Global Aggregate Bond Indexes; dashed lines represent series averages, solid lines are +/-1 standard deviation from the average; shaded regions represent periods of US recession; source: Guardian Capital using data from Bloomberg to January 12, 2024
Debt with shorter maturities continues to also offer a yield advantage over issues with longer duration. This segment of the bond market, however, is likely to be most vulnerable to any upward shifts in the expected policy path, while it is also subject to growing reinvestment risk as rates are anticipated to move lower and make holding cash less attractive.
Adding duration would also appear to make sense from a balanced portfolio perspective in the current environment.
The yield available provides decent return prospects with less reinvestment risk and somewhat limited valuation risk (i.e., there appears to be more scope for rates to decline over time than to rise further), but perhaps more importantly, these bonds also provide insurance against a deterioration in conditions that raises the impetus for rate cuts, suggesting that the highly correlated performance of stocks and bonds seen over the last couple of years could decouple.
Continuing with the balanced portfolio perspective, while the move higher in market interest rates over the last two years has significantly improved the forward-looking risk/reward profile of bonds, it remains the case that the outlook and relative valuations continue to lean in favour of equities.
Chart 32: It’s all relative
Fed equity valuation model*
(percent)
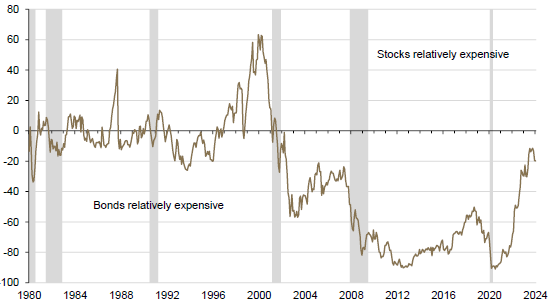
*S&P 500 composite price index26 divided by S&P 500 fair-value defined as S&P 500 12-month forward consensus earnings per share dividend by Bloomberg Treasury bond index19 yield; shaded regions represent periods of US recession; source: Guardian Capital based on data from Bloomberg to
January 12, 2024
This is particularly the case considering the historically varied performance within stock market over the last 12 months — for example, nearly three-quarters of the constituent stocks that make up the S&P 500 underperformed the index in 2023, a record going back four decades.
Chart 33: Out of breadth
Share of S&P 500 stocks underperforming in the index
(percent)
Source: Guardian Capital using data from Apollo Global Management and Bloomberg to December 31, 2023
In other words, broad market valuation metrics may not be overly representative of the market at the moment as they are skewed by the significant outperformance of a small number of stocks.
Further to this point, while price-to-earnings ratio for the market-capitalization weighted S&P 500 points to the broad US equity market starting the year at a valuation that is almost one standard deviation above its average (and therefore on the expensive side of history), the equal-weighted version of the index is trading just at average levels.
Chart 34: Moving averages
Forward price-to-earnings ratio, S&P 500
(ratio)
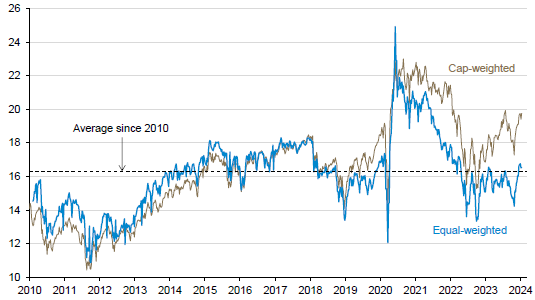
Source: Guardian Capital using data from Bloomberg to January 12, 2024
Therefore, most stocks are actually more reasonably valued than the overall metric would otherwise imply, suggesting that there are opportunities for active and selective investors — especially for those with a more global focus.
Chart 35: Worth a closer look
MSCI Index forward price-to-earnings ratio
(standard deviations from average since 2010)
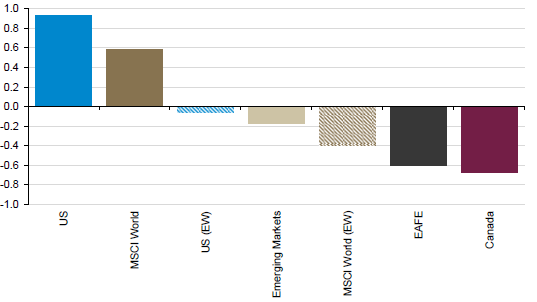
*EW=equal-weighted versions of the index; source: Guardian Capital using data from Bloomberg to January 12, 2024
Moreover, the prospect that equities in general may not be “priced for perfection” means that there is some cushion in the event that earnings expectations prove too optimistic.
Earnings forecasts have seen upward revisions against the less uncertain outlook, with analysts anticipating global profits will rebound after a sluggish 2023, with growth of roughly 10% in 2024 (with regional variation) reflecting modest increases in sales being amplified by the expectation that firms will be able to expand margins.
Chart 36: Earning their keep?
MSCI Index consensus* earnings per share growth
(year-over-year percent change; US dollar basis)
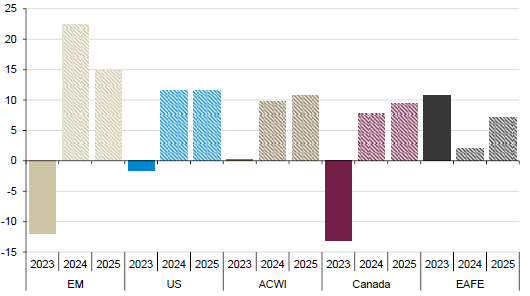
*Bloomberg consensus forecasts; source: Guardian Capital using data from Bloomberg as at January 12, 2024
While these forecasts may seem lofty, given the anticipated backdrop of low growth and moderating inflation, in the absence of some sort of shock, there appears little reason for a material shift in expectations in the near term.
The market, therefore, appears as though it will have a fundamental support, which, combined with indications of improving investor sentiment and reasonable valuation, would suggest there is scope for market breadth to improve and sustain upward market momentum for the coming months despite potential volatility-driven starts and stops.
There is no doubt the coming year will provide new developments and challenges that will cause markets to re-evaluate the prospects of what lies ahead. As great (and profitable) as it would be to know how everything will end up, there remains persistent uncertainty that will likely keep the outcomes for markets and the economy in 2024 largely unknowable until the year is over.
That said, the confidence intervals around forecasts at the moment are narrower than they have been in years, as the key drivers of the underlying resilience in the global economy still largely remain in place and the key headwinds of high interest rates and inflation look to subside.
Accordingly, the outlook for the months ahead appears conducive to positive, if unspectacular, risk asset performance that could allow for a collective sigh of relief following three highly volatile years.
This recent history, however, combined with the continued prevalence of risks to the outlook, underline the importance of maintaining a focus on managing risk exposures — and the decades-best opportunities present in the bond market for relatively safe, income-generating assets appear to provide a plus in this column.
After all, to use another “Yogi-ism”, “If the world were perfect, it wouldn’t be.”
All returns in CAD
This commentary is for general informational purposes only and does not constitute investment, financial, legal, accounting, tax advice or a recommendation to buy, sell or hold a security. It shall under no circumstances be considered an offer or solicitation to deal in any product or security mentioned herein. It is only intended for the audience to whom it has been distributed and may not be reproduced or redistributed without the consent of Guardian Capital LP. This information is not intended for distribution into any jurisdiction where such distribution is restricted by law or regulation.
The opinions expressed are as of the date of publication and are subject to change without notice. Assumptions, opinions and estimates are provided for illustrative purposes only and are subject to significant limitations. Reliance upon this information is at the sole discretion of the reader. The opinions expressed are as of the published date and are subject to change without notice. Assumptions, opinions and estimates are provided for illustrative purposes only and are subject to significant limitations. Reliance upon this information is at the sole discretion of the reader. This document includes information concerning financial markets that were developed at a particular point in time. This information is subject to change at any time, without notice and without update. This commentary may also include forward-looking statements concerning anticipated results, circumstances, and expectations regarding future events. Forward-looking statements require assumptions to be made and are, therefore, subject to inherent risks and uncertainties. There is a significant risk that predictions and other forward-looking statements will not prove to be accurate. Investing involves risk. Equity markets are volatile and will increase and decrease in response to economic, political, regulatory and other developments. Investments in foreign securities involve certain risks that differ from the risks of investing in domestic securities. Adverse political, economic, social or other conditions in a foreign country may make the stocks of that country difficult or impossible to sell. It is more difficult to obtain reliable information about some foreign securities. The costs of investing in some foreign markets may be higher than investing in domestic markets. Investments in foreign securities also are subject to currency fluctuations. The risks and potential rewards are usually greater for small companies and companies located in emerging markets. Bond markets and fixed-income securities are sensitive to interest rate movements. Inflation, credit and default risks are all associated with fixed income securities. Diversification may not protect against market risk and loss of principal may result. Index returns are for information purposes only and do not represent actual strategy or fund performance. Index performance returns do not reflect the impact of management fees, transaction costs or expenses. Certain information contained in this document has been obtained from external parties, which we believe to be reliable; however, we cannot guarantee its accuracy.
Guardian Capital LP manages portfolios for defined benefit and defined contribution pension plans, insurance companies, foundations, endowments and investment funds. Guardian Capital LP is a wholly owned subsidiary of Guardian Capital Group Limited, a publicly traded firm listed on the Toronto Stock Exchange. For further information on Guardian Capital LP, please visit www.guardiancapital.com. All trademarks, registered and unregistered, are owned by Guardian Capital Group Limited and are used under license.
January 2024
1 The MSCI World Index captures mid- and large-cap representation across 23 developed market countries.
2 The ICE BofA US Corporate & Government Index tracks the performance of investment-grade debt publicly issued in the US markets, including sovereign, quasi-government and corporate securities.
3 Federal Reserve Bank of Philadelphia Surveys & Data Real-Time Data Research Survey of Professional Forecasters, November 13, 2023, https://www.philadelphiafed.org/surveys-and-data/real-time-data-research/survey-of-professional-forecasters
4 Board of Governors of the Federal Reserve, Testimony, Testimony, Semiannual Monetary Policy Report to the Congress, March 07, 2023, https://www.federalreserve.gov/newsevents/testimony/powell20230307a.htms
5 The Organisation for Economic Co-operation and Development (OECD+) is an aggregate including the 38 OECD economies and six major non-member economies (Brazil, China, India, Indonesia, Russia and South Africa).
6 The Geopolitical Risk Index, created by Dario Caldara and Matteo Iacoviello, is a measure of adverse geopolitical events and associated risks based on a tally of newspaper articles covering geopolitical tensions. The index reflects automated text-search results of the electronic archives of 10 newspapers related to adverse geopolitical events in each newspaper for each month (as a share of the total number of news articles).
7 The “Global Economic Policy Uncertainty Index” is a GDP-weighted average of national Economic Policy Uncertainty (EPU) indices for 16 countries that account for two-thirds of global output. Each national EPU index reflects the relative frequency of own-country newspaper articles that contain a trio of terms pertaining to the economy, uncertainty and policy-related matters.
8 The MSCI ACWI is a market capitalization weighted index of equities in both Developed and Emerging Markets.
9 The S&P 500 is an index of 500 stocks designed to reflect the risk/return characteristics of the large-cap US equity universe.
10 The Bank for International Settlements (BIS) supports central banks’ pursuit of monetary and financial stability through international cooperation, and to act as a bank for central banks.
11 The MSCI indexes are free-float weighted equity indexes and are designed to measure the performance of large and mid-cap segments of a given domestic equity market. The MSCI EAFE Index is a stock market index that is designed to measure the equity market performance of developed markets outside of the U.S. and Canada. The MSCI USA Index is designed to measure the performance of the large and mid-cap segments of the US market. The MSCI Canada Index is designed to measure the performance of the large and mid-cap segments of the Canadian market. The MSCI China Index captures large and mid-cap representation across China A shares, H shares, B shares, Red chips, P chips and foreign listings (e.g. ADRs). The MSCI Emerging Markets ex China Index captures large and mid-cap representation across 23 of the 24 Emerging Markets (EM) countries* excluding China. With 672 constituents, the index covers approximately 85% of the free float-adjusted market capitalization in each country.
12 The Bloomberg Global Aggregate Bond Index is a flagship measure of global investment grade debt from twenty-four local currency markets. This multi-currency benchmark includes treasury, government-related, corporate and securitized fixed rate bonds from both developed and emerging market issuers.
13 The International Monetary Fund (IMF) works to achieve sustainable growth and prosperity for all of its 190 member countries.
14 Percent of balance that is either 90-day late, 120-day late or severely derogatory. 90+ days late is synonymous to seriously delinquent. Not all creditors provide updated information on payment status, especially after accounts have been derogatory for a longer period of time. Thus the payment performance profiles obtained from our data may to some extent reflect reporting practices of creditors.
15 Federal Reserve Bank of New York, Quarterly report on household debt and credit, 2023:Q3, November 2023, https://www.newyorkfed.org/medialibrary/interactives/householdcredit/data/pdf/HHDC_2023Q3
16 The Purchasing Managers Index (PMI) is a measure of the prevailing direction of economic trends in manufacturing and services sectors; based on a monthly survey of companies to determine whether business conditions are improving, unchanged, or deteriorating compared to the previous survey, seasonally adjusted
17 The composite leading indicator (CLI) is designed to provide early signals of turning points in business cycles showing fluctuation of the economic activity around its long-term potential level. CLIs show short-term economic movements in qualitative rather than quantitative terms.
18 U.S. Bureau of Labor Statistics, BLS Beta Lab, https://beta.bls.gov/dataViewer/view/timeseries/WPSID612
19 Inflation measured by the consumer price index (CPI) is defined as the change in the prices of a basket of goods and services that are typically purchased by specific groups of households.
20 Board of Governors of the Federal Reserve, Monetary Policy, Summary of Economic Projections, December 13, 2023, https://www.federalreserve.gov/monetarypolicy/files/fomcprojtabl20231213.pdf
21 The Goldman Sachs Financial Conditions Index is a weighted average of short-term interest rates, long-term interest rates, the trade-weighted dollar, an index of credit spreads, and the ratio of equity prices to the 10-year average of earnings per share.
22 Varieties of Democracy, Dataset Archive, January 12, 2024, https://v-dem.net/data/dataset-archive/
23 National Democratic Institute, Global Elections Calendar, January 12, 2024, https://www.ndi.org/elections-calendar
24 International Monetary Fund, World Economic Outlook, Navigating Global Divergence, April 10, 2023, https://www.imf.org/en/Publications/WEO/Issues/2023/10/10/world-economic-outlook-october-2023
25 The “break-even” inflation rate is the inflation rate required to equalize nominal and real interest rates and is calculated by taking the difference between yields on nominal and “inflation-linked” (or “real return”) sovereign bonds.
26 The S&P 500 is an index of 500 stocks designed to reflect the risk/return characteristics of the large-cap US equity universe.