
Viewpoint: US consumer price inflation data
Another upside surprise spurs further repricing of the Fed Once again, inflation data has provided an upside surprise, with the […]
Fixed income (FI) markets globally are experiencing one of the worst years in decades. The FTSE Canada Universe Bond Index (Index) is down -12.66% on a year-to-date basis (as of October 31, 2022). This drawdown, if it holds into year-end, will result in two notable features that contrast with the Canadian bond market over the last 40 years: it will be the worst year on record and the first time for two consecutive years of negative returns. These historic breaks serve to underline the severity of the absolute underperformance of the asset class and raise the question about the potential that the bond market’s risk profile is better balanced and may be an opportunity for better returns in 2023. After all, we still see bonds as a portfolio diversifier and, under current conditions, a source of healthy income.
Chart 1: Worst performing year for the local universe FI market in more than four decades
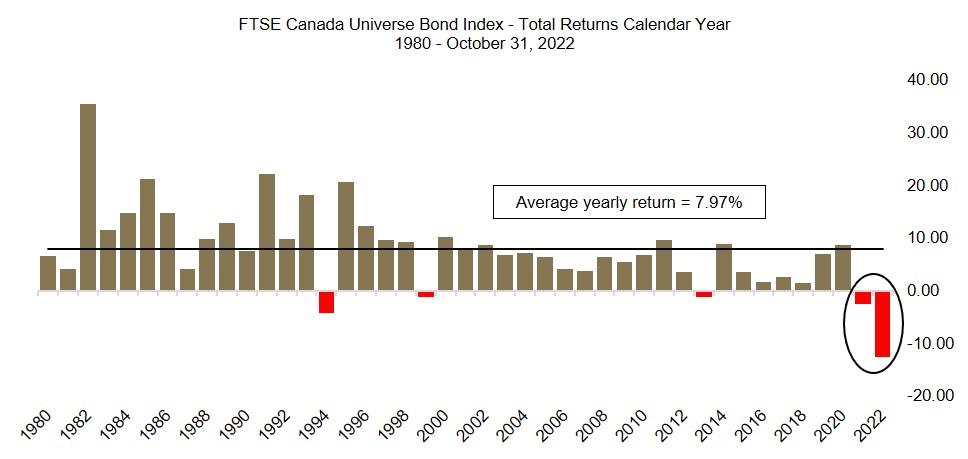
Source: Guardian Capital based on data from FTSE. As of October 31, 2022.
Bonds, locally and globally, have been under a lot of stress, as central banks across the globe have opted for an aggressive hiking cycle in their fight against record inflation resulting in higher yields (bond prices move in the opposite direction to yields). In practice, this means front-loading rate hikes to reach a restrictive bias within a short period. Something we haven’t seen in many decades.
It is fair to say, this year has been a shock to bond investors and their portfolios on many fronts. Yet, amidst this turmoil, there are few notable signs that the bond market is bottoming out.
The Bank of Canada (BoC) began the hiking cycle hoping to engineer a soft landing while getting inflation back to its target. The bond market’s curve slope – namely the difference between the 2-year yield and the 10-year yield – is typically a strong predictor of growth risks 12 to 18 months out. When the 10-year yield is lower than the 2-year yield, the forecast is for slower growth and if this feature, a curve inversion, is deep and sustained, the historical precedence is a recession a year out. Currently, the curve is inverted by 65bps, historically deep (Chart 3), and the BoC’s forward guidance suggests that this inversion will persist well into 2023. Further, a similar case can be made for the US economic outlook based on the shape of its 2-year and 10-year slope as shown in Chart 2. BoC projects GDP growth will slow down from 3.25% this year to just under 1% next year. With both economies forecasted to slow down aggressively or enter a recession, a pause in tightening is imminent.
Chart 2: US recession probability vs. yield curve
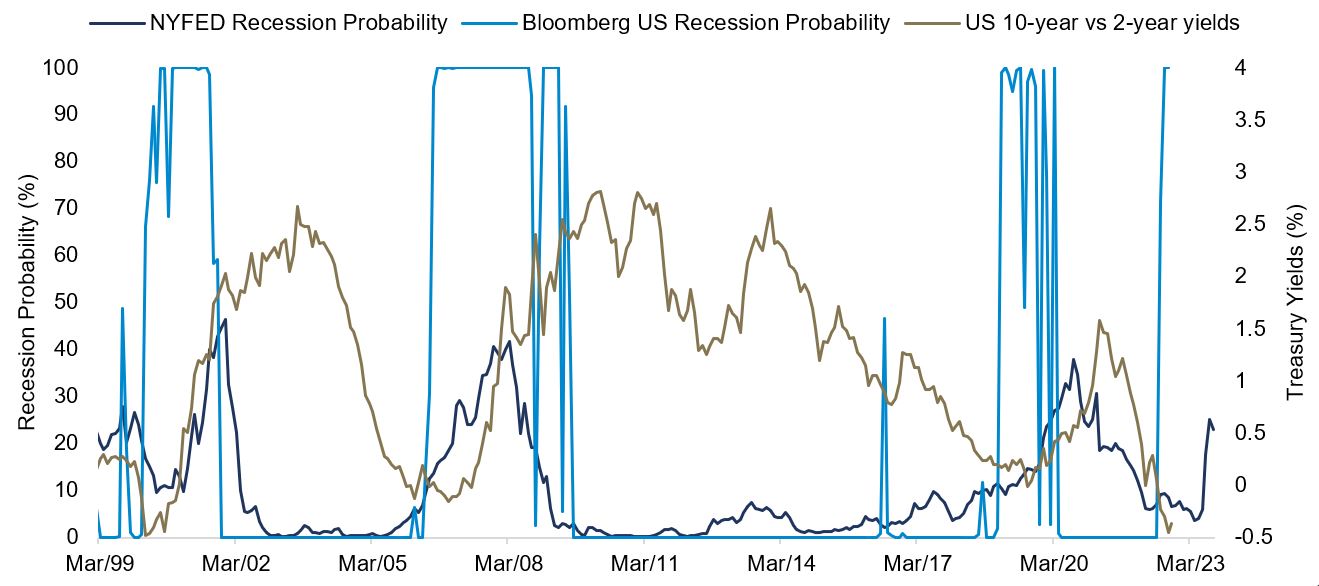
Source: Guardian Capital based on data from Bloomberg. As of September 30, 2022.
Chart 3: Canada yield curve inversion
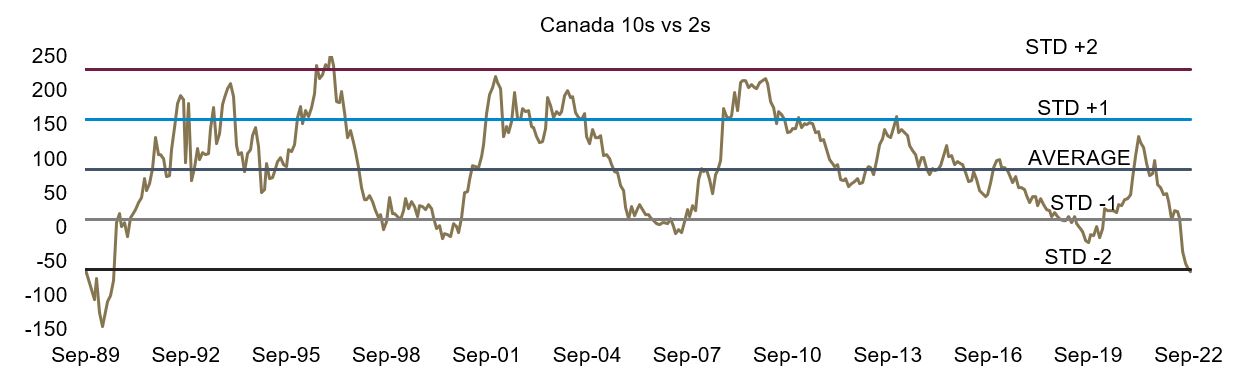
Source: Guardian Capital based on data from Bloomberg. As of October 25, 2022.
Coming into 2022, corporate bonds significantly outperformed government bonds, as spreads tightened to a multi-decade low since reaching the highs during COVID-19. The credit market has sold-off massively on a year-to-date basis, as risk-off sentiments, concerns around global growth slowdown and geopolitical tensions all weighed on the asset class. Current spread levels, arguably, are pricing in a significant amount of deterioration in corporate fundamentals, which, so far, have been resilient. Corporate bonds offer an attractive entry point from a valuation perspective.
Chart 4: Canadian IG Credit Spreads
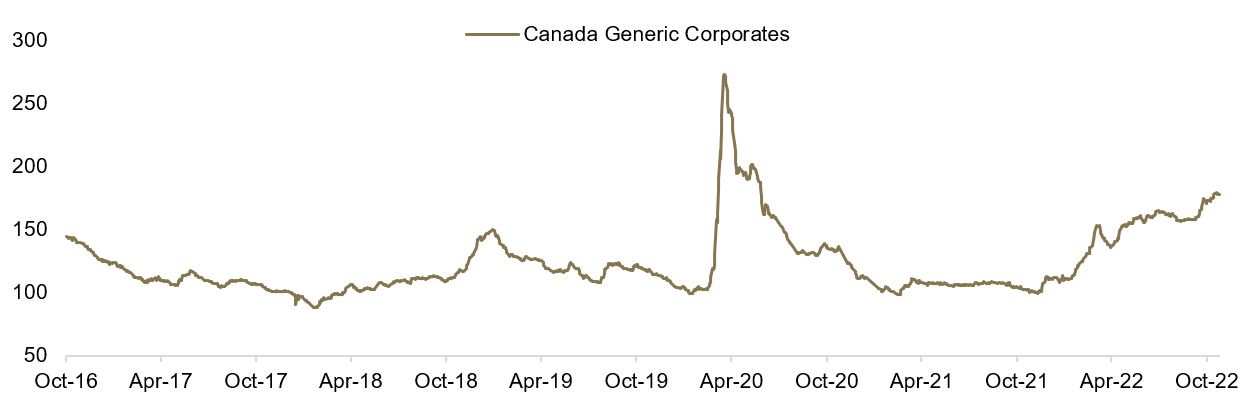
Source: Guardian Capital based on data from Bloomberg. As of October 31, 2022.
BoC raised its overnight policy rate target by 50bps (to 3.75%) on October 26, 2022, a smaller than anticipated hike than markets had priced in (+75bps was the expectation) given the previous week’s surprisingly firm inflation data. We believe we are moving closer to the terminal rate for the central bank. Volatility in the bond market has remained elevated in the past few months and the Merrill Lynch Option Volatility Estimate Index, known as the MOVE Index, an indicator used to measure bond-market volatility, is now trading at 30% above its 200 moving day average, levels last seen during the Great Financial Crisis.
Chart 5: Bond market volatility piercing through
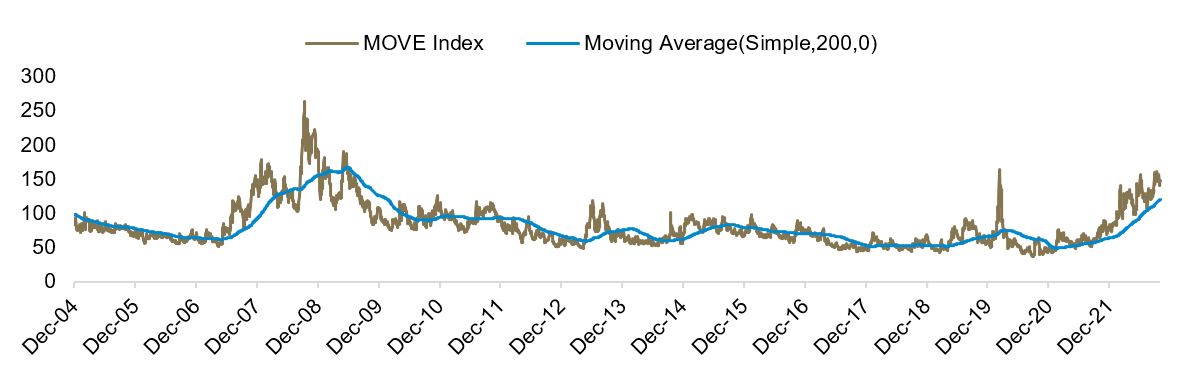
Source: Guardian Capital based on data from Bloomberg. As of October 31, 2022.
The fixed income team at Guardian Capital LP is focusing on the future potential for the asset class, which, they believe, may not be as bad as initially feared. As such, we believe investors sitting on the sidelines for much of 2022, and who have excess cash to deploy or to restructure their asset allocation, may look to focus on this asset class once again.
Yields are the highest they have been in more than a decade
There has been a material capital depreciation in 2022. However, the rolling income by reinvesting at a higher yield, along with the higher yield itself of 4.31% for the Index (a proxy of future returns), will provide investors a greater income component to future returns, and will assist in insulating against capital value volatility in the FI markets.
Interest rate risk vs Yield
However, it is not just the higher yield in itself that is proving to be attractive. From an interest rate or duration risk point of view, the yield pick-up per unit of duration hasn’t looked as attractive as it is now in over a decade (Chart 7) signaling an attractive entry point for investors.
Chart 6: FTSE Canada Universe Bond Index Yield (ending October 31, 2022)
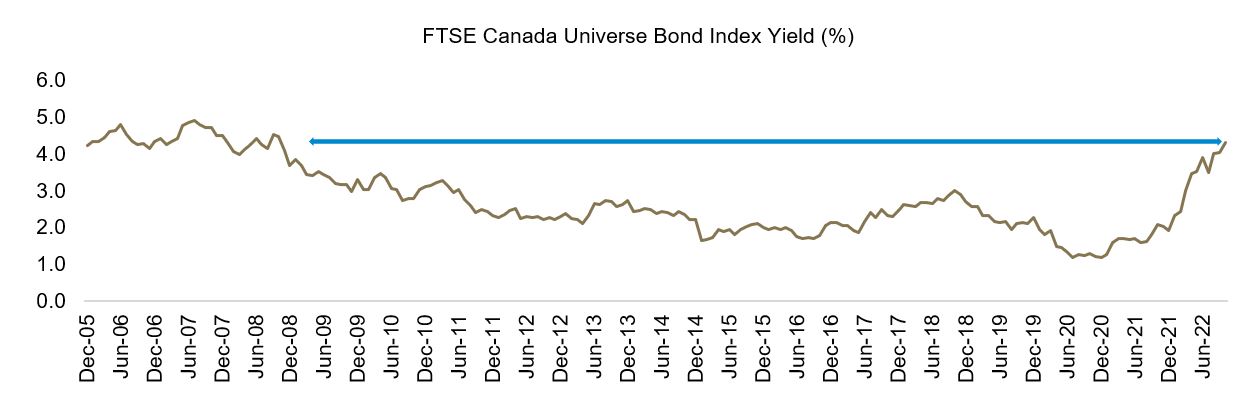
Source: Guardian Capital based on data from Bloomberg and PC Bond. As of October 31, 2022.
Chart 7: FTSE Canada Universe Bond Index Yield vs. Duration (ending October 31, 2022)
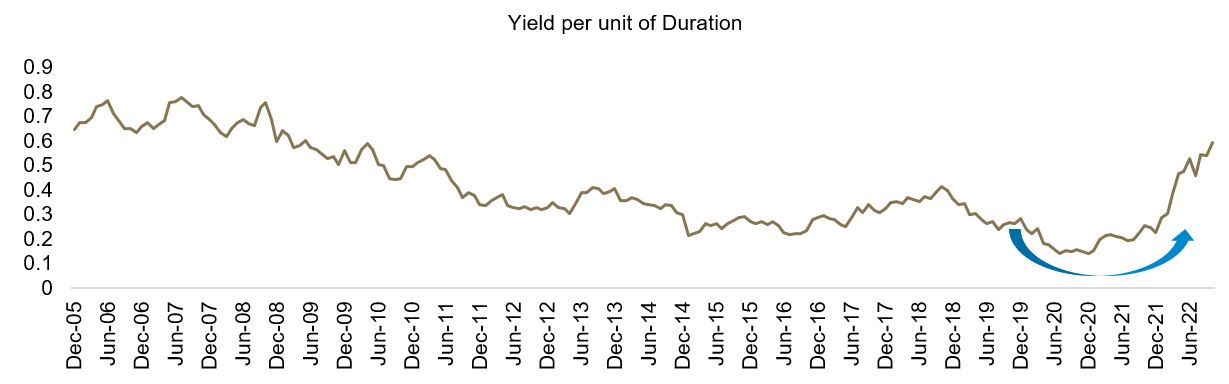
Source: Guardian Capital based on data from Bloomberg and PC Bond. As of October 31, 2022.
The most attractive segment of the fixed-income market currently is in the short-term, investment-grade credit. Short-term corporates are offering a 5.40% yield with an average duration of 2.75 years. This means these bonds are less sensitive to incrementally higher rates, especially if BoC exceeds market expectations on their policy rate. Even though the spreads have widened significantly this year, pricing in a significant amount of deterioration, corporate fundamentals remain resilient.
Yields vs. next 12-month return trajectory
It is important to highlight that while past performance does not guarantee future returns, it can provide insight into previous cycles and bond market behaviour.
We looked at historical relationships between the beginning period of 10-year Government of Canada yields and the 12-month horizon total return for the Index spanning over the last 17 years. Historically, whenever the 10-year yield has traded between 3% to 3.5%, which it currently is, the average next 12 months’ returns for the Index is 7.4% (based on 93 weekly data points). Last week (as of November 9, 2022), 10-year Canada yields traded well over 3%.
This illustrates the concept of total returns converging to the Internal Rate of Return of a portfolio or Yield to Maturity over longer time horizons. Given the recent move higher in yields, forward returns are now much more attractive, and returns over the next twelve months look promising, despite the volatility of capital markets.
Chart 8: Canada 10-year yields vs FSTE Canada Universe Bond Index 12-month returns horizon based on last 17 years’ weekly yield vs. total return data (ending October 31, 2022)
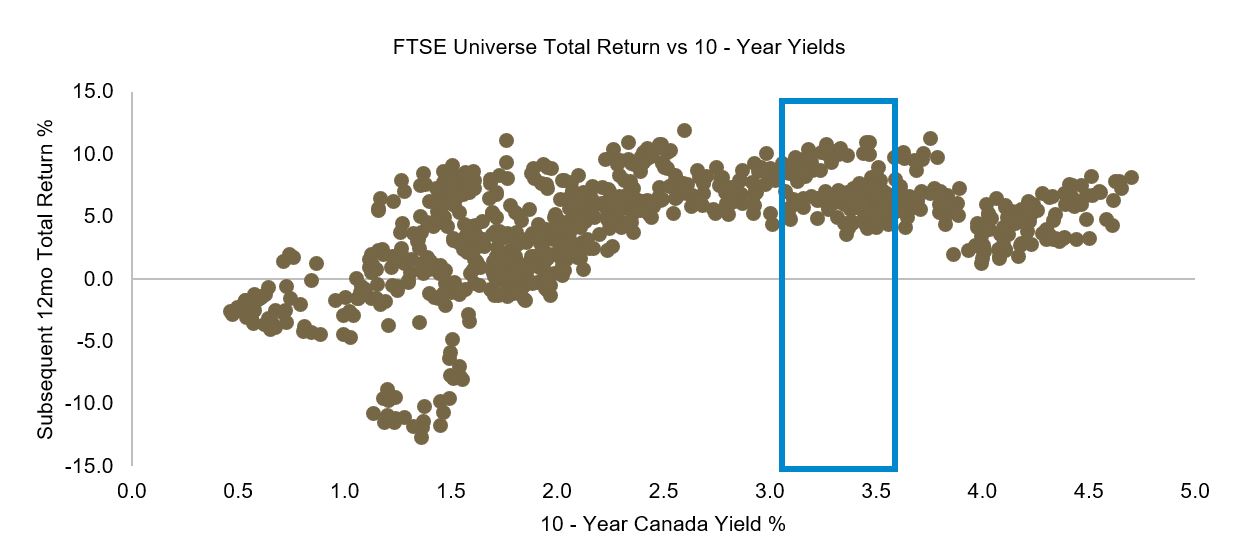
Source: Guardian Capital based on data from Bloomberg. As of October 31, 2022.
We continue to expect volatility in interest rates and credit spreads – at least to the next central bank meetings (BoC, December 7, 2022, Federal Reserve, December 14, 2022) – as each data point influences all markets’ expectations of the future path of interest rates. In this environment, we would like to reiterate the potentially stronger risk/reward profile offered by short-duration, investment-grade bonds. We believe that locking in solid yields over the near term may offset any roller-coaster moves in the stock market.
This commentary is for informational purposes only and does not constitute investment, financial, legal, accounting, tax advice or a recommendation to buy, sell or hold a security. It shall under no circumstances be considered an offer or solicitation to deal in any product or security mentioned herein. It is only intended for the audience to whom it has been distributed and may not be reproduced or redistributed without the consent of Guardian Capital LP. This information is not intended for distribution into any jurisdiction where such distribution is restricted by law or regulation.
The opinions expressed are as of the date of publication and are subject to change without notice. Assumptions, opinions and estimates are provided for illustrative purposes only and are subject to significant limitations. Reliance upon this information is at the sole discretion of the reader. This document includes information concerning financial markets that was developed at a particular point in time. This information is subject to change at any time, without notice, and without update. This commentary may also include forward looking statements concerning anticipated results, circumstances, and expectations regarding future events. Forward-looking statements require assumptions to be made and are, therefore, subject to inherent risks and uncertainties. There is significant risk that predictions and other forward-looking statements will not prove to be accurate. Investing involves risk. Equity markets are volatile and will increase and decrease in response to economic, political, regulatory and other developments. Investments in foreign securities involve certain risks that differ from the risks of investing in domestic securities. Adverse political, economic, social or other conditions in a foreign country may make the stocks of that country difficult or impossible to sell. It is more difficult to obtain reliable information about some foreign securities. The costs of investing in some foreign markets may be higher than investing in domestic markets. Investments in foreign securities also are subject to currency fluctuations. The risks and potential rewards are usually greater for small companies and companies located in emerging markets. Bond markets and fixed-income securities are sensitive to interest rate movements. Inflation, credit and default risks are all associated with fixed income securities. Diversification may not protect against market risk and loss of principal may result. Index returns are for information purposes only and do not represent actual strategy or fund performance. Index performance returns do not reflect the impact of management fees, transaction costs or expenses. Certain information contained in this document has been obtained from external parties which we believe to be reliable, however we cannot guarantee its accuracy.
Guardian Capital LP manages portfolios for defined benefit and defined contribution pension plans, insurance companies, foundations, endowments and investment funds. Guardian Capital LP is wholly owned subsidiary of Guardian Capital Group Limited, a publicly traded firm listed on the Toronto Stock Exchange. For further information on Guardian Capital LP, please visit www.guardiancapital.com. Guardian, Guardian Capital and the Guardian gryphin design are trademarks of Guardian Capital Group Limited, registered in Canada.