“The real fortunes in this country have been made by people who have been right about the business they invested in, and not right about the timing of the stock market.” – Warren Buffett
It’s easy to stay invested when markets are up. It’s far more difficult when they are down. We believe investors are best served by ignoring the day-to-day, month-to-month, and even year-to-year fluctuations of the stock market and focus instead on the long term.
As tempting as it can be to imagine scenarios in which we are able to invest our money at the bottom and cash out at the top (also known as timing the market), the reality is that no one knows ahead of time when those tops and bottoms will occur. In order for a market timing strategy to be successful, an investor must correctly decide both when to buy and when to sell. Yet, this is difficult for even the most experienced investors and making the wrong call on market timing can negatively impact total returns.
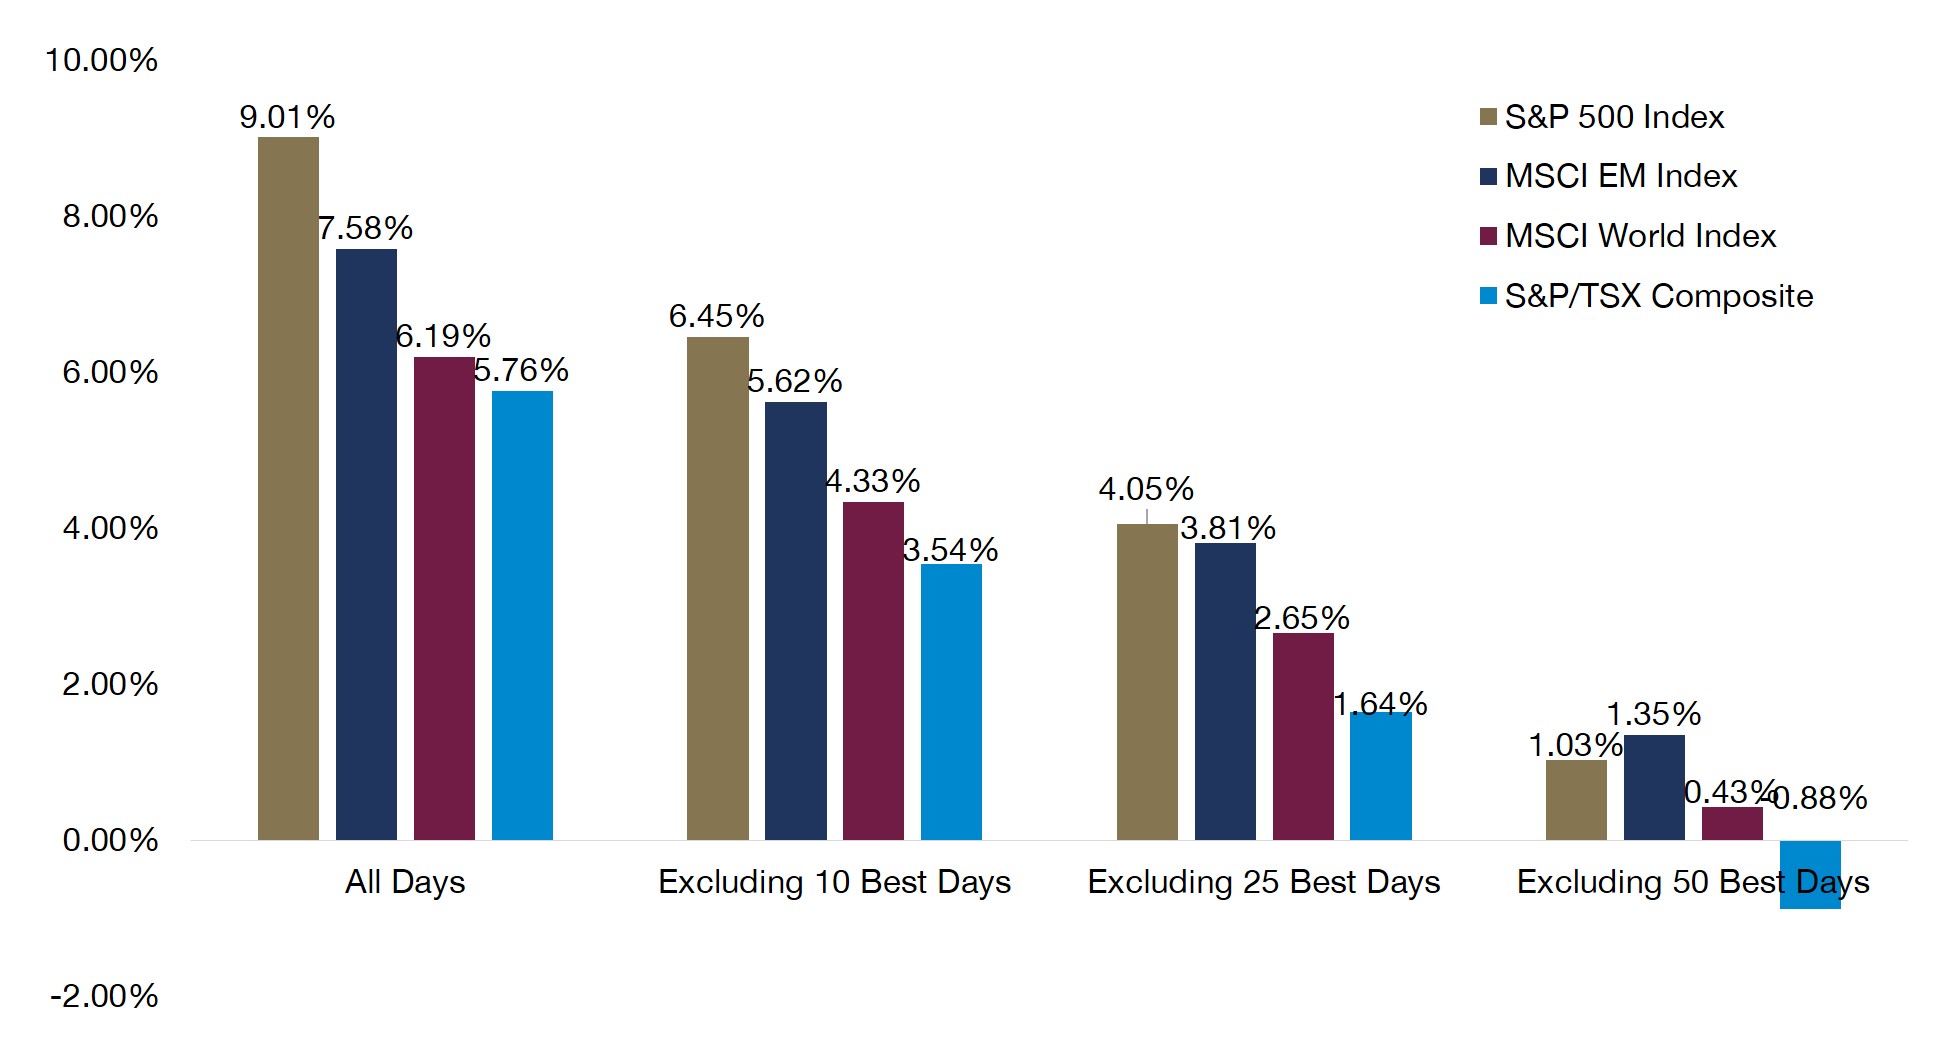
Looking back at broad global index data since 1988, if an investor missed only the 10 best days of returns from the S&P 500 Index, their total annualized return would be more than 2.5% lower than an investor who remained in the market the whole time. When it comes to Canadian equities, missing the best 25 days would see an investor’s annualized return decline by more than two-thirds.

Source: Guardian Capital LP based on data sourced from Bloomberg as of March 31, 2022. Daily returns since January 1, 1988 annualized in CAD.
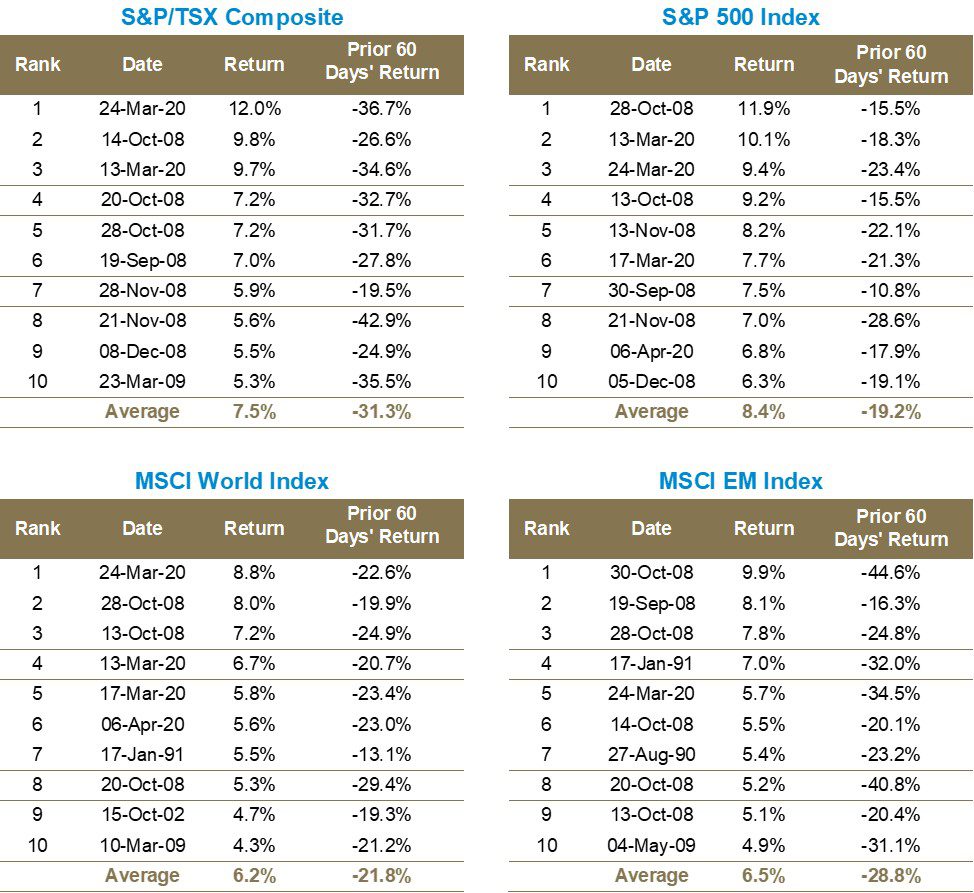
While the goal of any market timer is to miss the periods of lowest returns, not the highest, history shows that the latter most frequently occurs immediately after a period of significant losses. It is incredibly unlikely that any investor could time the market so well as to consistently avoid this period of negative return, then invest in the market again to capture one of these historical highest single-day returns.
In fact, using Canadian equities as an example, the average return over the 10 highest single-day returns was 7.5%, while the average return over the 60-trading day period that preceded each of those 10 days was -31.3%! The tables below show this holds across asset classes.

Source: Guardian Capital LP based on data sourced from Bloomberg as of March 31, 2022. Daily returns since January 1, 1988 in CAD.
While it would be nice to avoid market downturns completely, the fact is that they occur reasonably frequently in equity markets. In Canadian dollar terms, a drop of at least 5% occurs every 12-18 months, on average, for equity markets around the world, while a drop of at least 10% occurs every 2-4 years.

Source: Guardian Capital LP based on data sourced from Bloomberg as of March 31, 2022. Returns since January 1, 1988 annualized in CAD
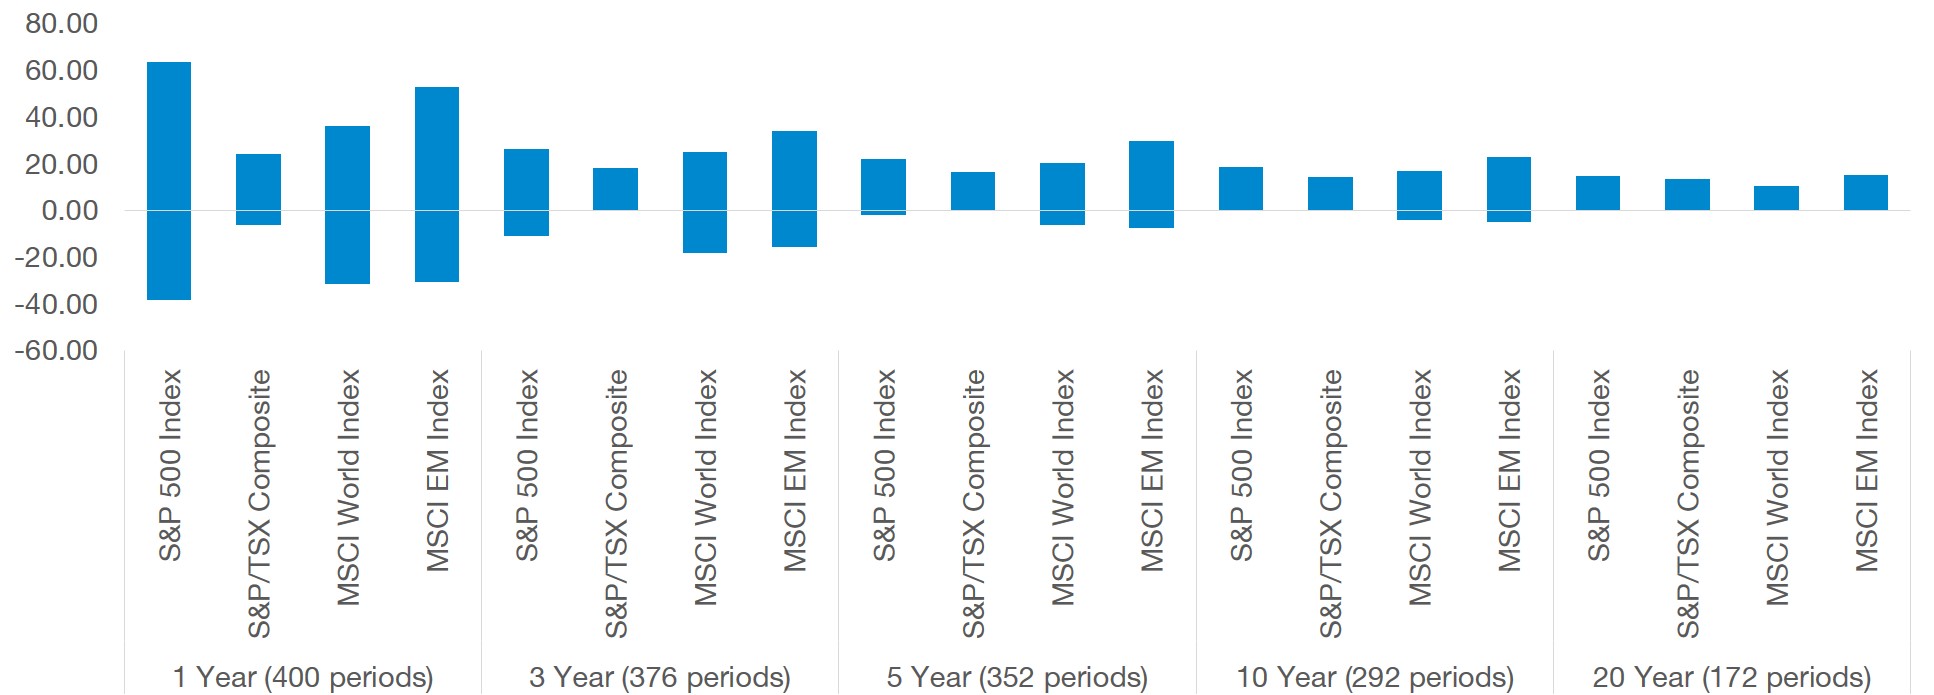
In the midst of market volatility, it may be tempting to reduce or even eliminate your investments in equities. Market gyrations can be difficult to tolerate, but history shows that the longer an investment was held, the less variable the returns were. The chart below demonstrates the range of returns investors have experienced in each asset class over various time periods. The Canadian equity market has seen 1-year returns range anywhere from -38% to +63% since 1988, while over any 20-year period the annualized returns have been in a much tighter (and entirely positive) range of +4% to +10%, despite covering significant downturns and periods of heightened volatility.

Source: Guardian Capital LP based on data sourced from eVestment as of March 31, 2022 using monthly returns since January 1988, in CAD.
Markets can be volatile and noisy, but maintaining a long-term focus and a disciplined approach to investing should help improve results over time. Significant downturns can occur frequently and it is very difficult to anticipate them accurately. Rather than trying to avoid them altogether, staying invested over the long run has historically seen investors rewarded. Ultimately, it is “time in” in the market rather than “timing” the market that is key to building wealth over the long term, proving the phrase “good things come to those who wait”.
Speak to a financial advisor to learn how a long-term and disciplined approach to investing can help you achieve your financial goals.
The S&P/TSX Composite Index is designed to be a broad measure of the largest companies listed on the Toronto Stock Exchange.
The S&P 500 Index is designed to be a measure of 500 widely held U.S. Companies, with a focus on large cap equities.
The MSCI World Index is designed to be a broad measure of both large and mid-cap equities across Developed Countries.
The MSCI Emerging Markets Index is designed to be a broad measure of Emerging Market equity performance in developing markets.
This communication is for informational purposes only and does not constitute investment, financial, legal, accounting, tax advice or a recommendation to buy, sell or hold a security, or be considered an offer or solicitation to deal in any product mentioned herein.
The opinions expressed are as of the published date and are subject to change without notice. Assumptions, opinions and estimates are provided for illustrative purposes only and are subject to significant limitations. Reliance upon this information is at the sole discretion of the reader. This document includes information and commentary concerning financial markets that was developed at a particular point in time. This information is subject to change at any time, without notice, and without update. This commentary may also include forward looking statements concerning anticipated results, circumstances, and expectations regarding future events. Forward-looking statements require assumptions to be made and are, therefore, subject to inherent risks and uncertainties. There is significant risk that predictions and other forward-looking statements will not prove to be accurate. Investing involves risk. Equity markets are volatile and will increase and decrease in response to economic, political, regulatory and other developments. Investments in foreign securities involve certain risks that differ from the risks of investing in domestic securities. Adverse political, economic, social or other conditions in a foreign country may make the stocks of that country difficult or impossible to sell. It is more difficult to obtain reliable information about some foreign securities. The costs of investing in some foreign markets may be higher than investing in domestic markets. Investments in foreign securities also are subject to currency fluctuations. The risks and potential rewards are usually greater for small companies and companies located in emerging markets. Bond markets and fixed-income securities are sensitive to interest rate movements. Inflation, credit and default risks are all associated with fixed income securities. Diversification may not protect against market risk and loss of principal may result. Certain information contained in this document has been obtained from external parties which we believe to be reliable, however we cannot guarantee its accuracy.
Guardian Capital LP manages portfolios for defined benefit and defined contribution pension plans, insurance companies, foundations, endowments and investment funds. Guardian Capital LP is a wholly owned subsidiary of Guardian Capital Group Limited, a publicly traded firm listed on the Toronto Stock Exchange. For further information on Guardian Capital LP, please visit www.guardiancapital.com. Guardian, Guardian Capital and the Guardian gryphin design are trademarks of Guardian Capital Group Limited, registered in Canada.


