
Originally published to www.bnnbloomberg.ca on September 16, 2021 Ted Macklin, managing director and head of Canadian Equity at Guardian […]
Global equity markets have been in the midst of a prolonged surge for several years, taking the MSCI World Index to historical highs. These last several years have seen the convergence of several themes that have created somewhat of a perfect storm. Post-financial crisis, we have been living in a world where markets have had tremendous tailwinds in the form of quantitative easing (“free money”). We’ve also seen many disruptive technology companies, that have been gestating since the tech bubble in the early 2000’s, experience what many would have considered to be highly implausible growth; transforming them into behemoths commanding top weighting in US and global indices. Younger investors, not having the benefit or wisdom associated with living through a full market cycle, also began entering the market at scale. Along with them came a seemingly ever-increasing appetite for risk, speculation and a “do-it-myself” mentality, as just about everything worked and returns of 100%, 200% and 300%+ on individual stocks have become a much more common experience.
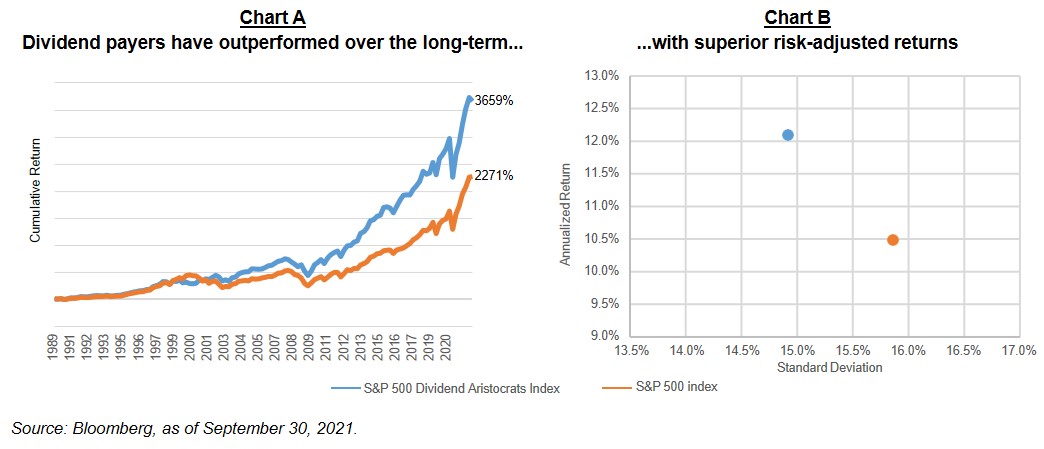
So where does that leave dividend payers? First, we should set the stage by looking at long-term data in Charts A and B below. We can see that dividend-paying companies in the US have outperformed the broad market with lower volatility. Clearly, investors have favoured the receipt of current income (dividends) over expectations of future capital appreciation and income potential.
Amidst the supercharged global growth environment, the question has to be asked: have dividend investors had their boats lifted by this rising tide? In absolute terms, the answer is yes. The 10-year annualized return of the MSCI World High Dividend Yield Index was 10% (in local currency terms) as of August 31, 2021 – certainly an attractive result by historical standards.
Yet, as dividend investors begin comparing results over recent years to the broader universe of global equities (MSCI World Index up 13.3% in local currency terms over the last 10 years), questions begin to arise about underperformance.
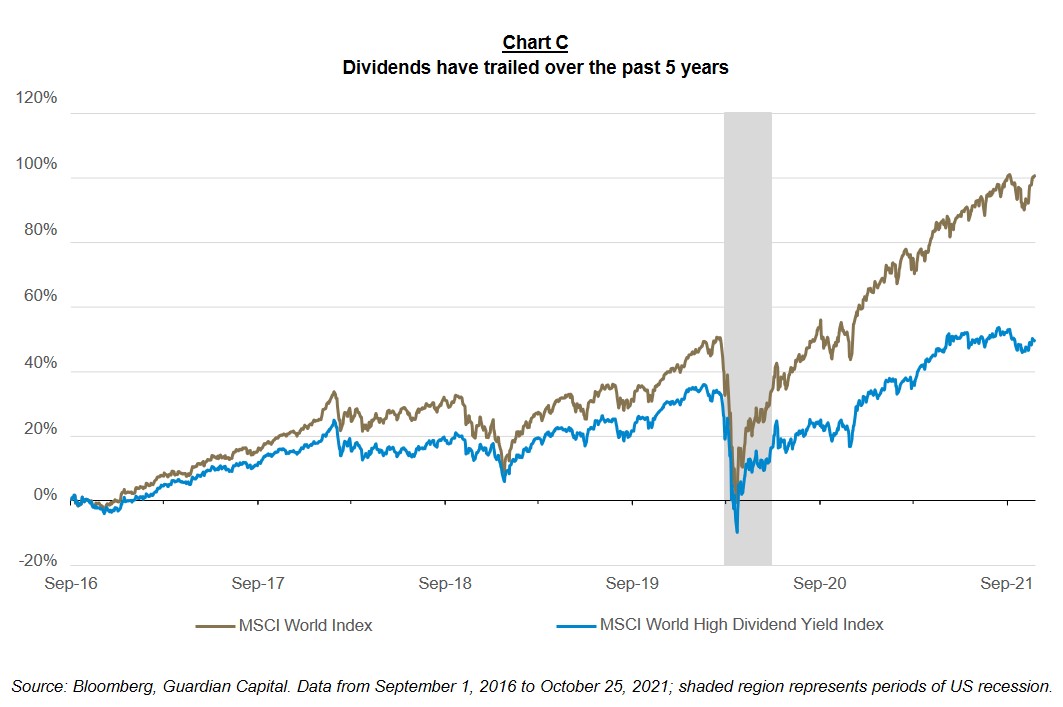
Shortening the look-back period to the past one, three and five years shows even greater degrees of underperformance. In fact, over the past five years, the performance of global dividends has been nearly doubled by the broad market, as seen is Chart C, below.
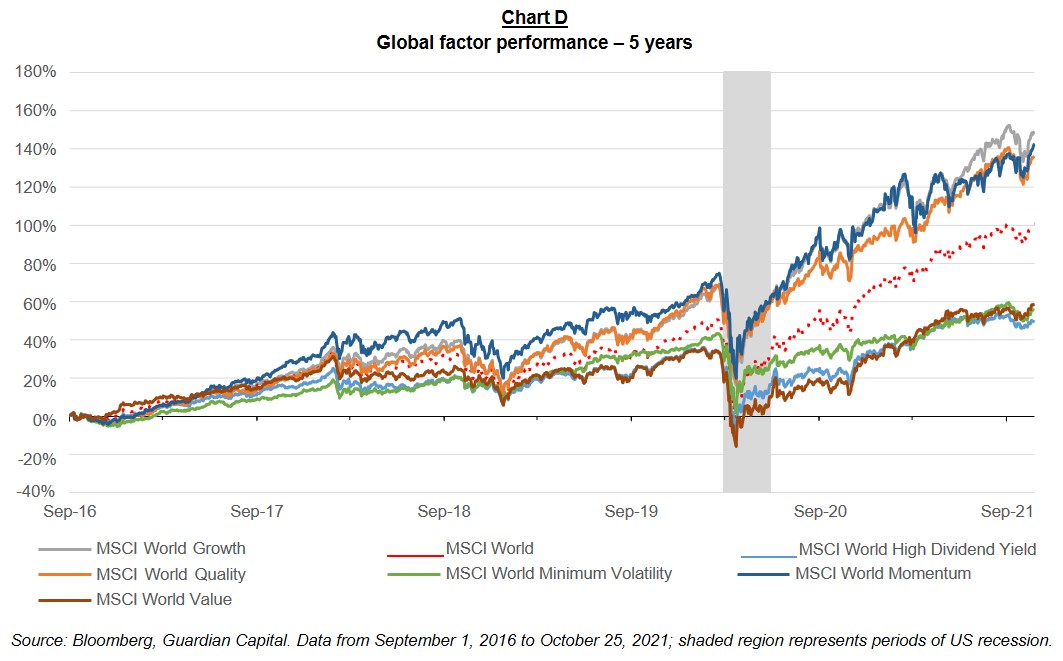
Is this simply a Style Factor issue? With the rising prominence of ETFs came an increased focus on scrutinizing returns based on factors – sets of characteristics that influence equity performance. Using these factors allows us to better address that question. When you take a look at the six main MSCI factor indices over the same five-year period, there’s a considerable divergence in performance, as seen in Chart D. At the top of the chart, we’ve seen Growth stocks dominate with a cumulative return of nearly 150% over the period, followed by Quality and Momentum, not too far behind. The big three underperformers were Minimum (Low) Volatility, Value and Dividend Yield.
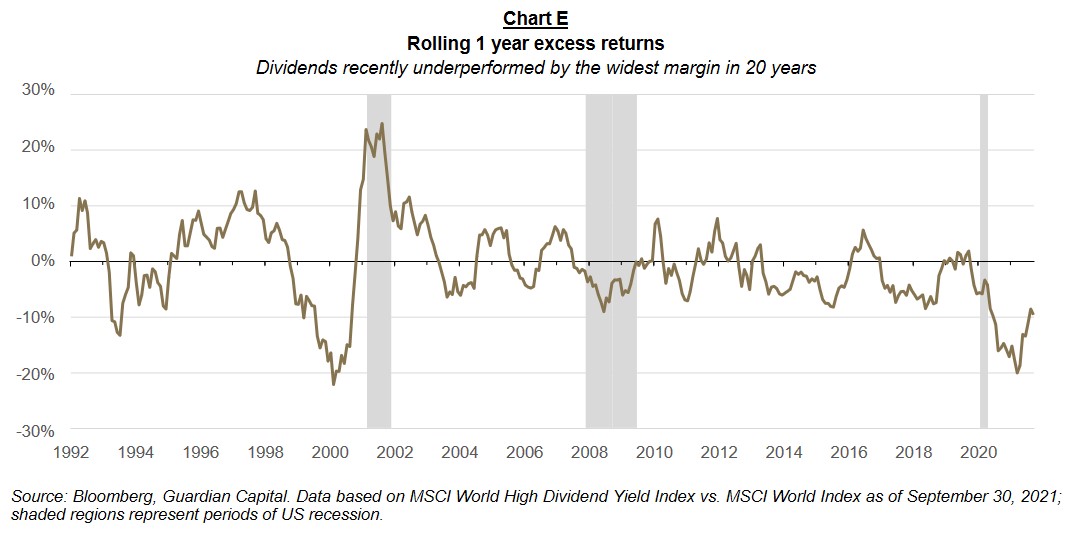
To provide additional context, we looked at the rolling one-year returns going back 30 years and plotted the relative performance of dividends versus the broad market, as seen in Chart E. What we found was that dividends recently underperformed by the widest margin in 20 years and the second-widest margin in 30 years (second only to the period immediately preceding the tech bubble bursting in early 2000). As of March 31, 2021, the one-year return for dividends was 20% below that of the MSCI World Index, but has moved in the right direction since then, trimming the deficit considerably but still trailing by over 9%.
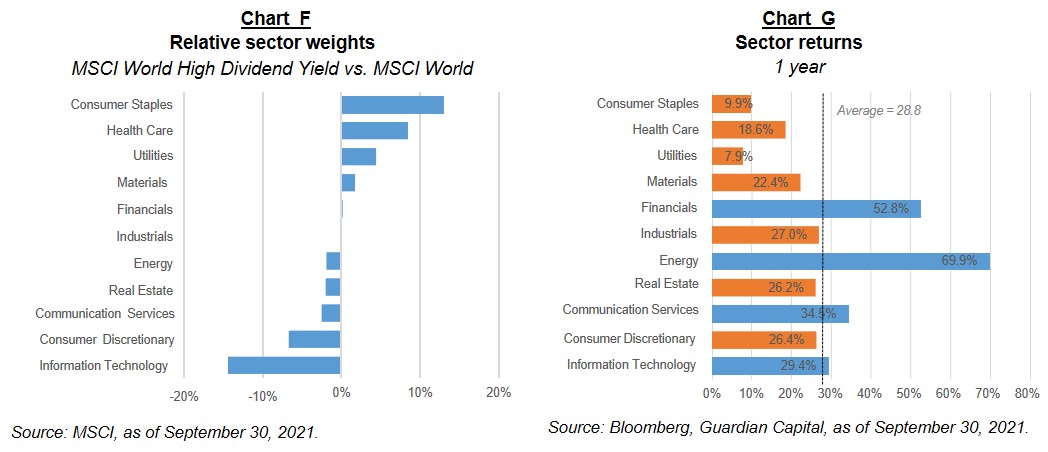
What explains the more recent underperformance? The relative sector composition provides a good indication. Relative to the MSCI World Index, the MSCI World High Dividend Yield Index is most overweight in defensive sectors (those traditionally less impacted by economic cyclicality). Consumer Staples, Health Care and Utilities were the three worst performing sectors over the past year and the sizable underweight position in the Information Technology sector was a considerable detractor for the High Dividend Yield Index.
Further, we need to recognize two important aspects of the MSCI World Index. First, it is comprised primarily of US equities; and second, US equities have been increasingly driven by FANGMA* stocks, which have dramatically outperformed in recent years (and which pay little or no dividends), meaning they often are not included in dividend mandates.
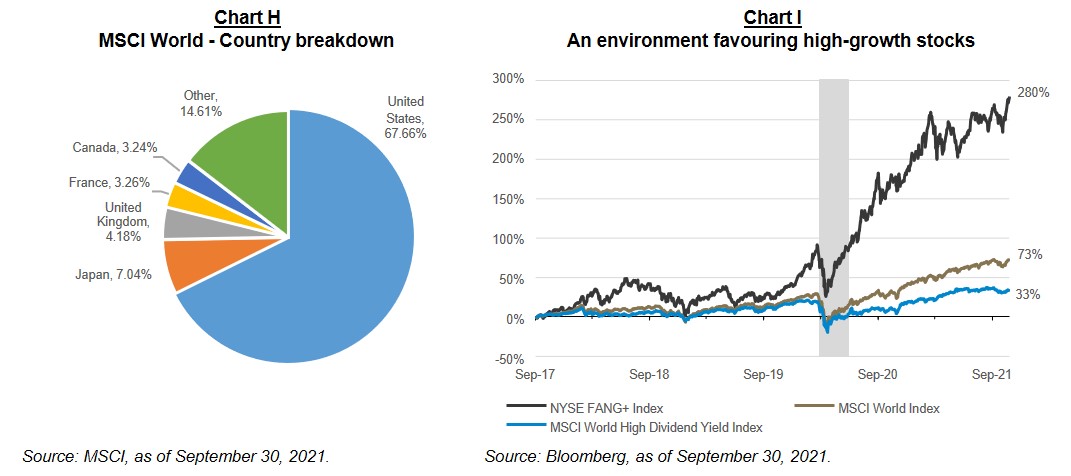
*Facebook, Apple, Netflix, Google (Alphabet), Microsoft, Amazon. NYSE FANG+ Index consists of 10 equally-weighted high-growth stocks, including: Facebook, Apple, Amazon, Netflix, Google, Alibaba (ADR), Baidu (ADR), NVIDIA, Tesla and Twitter.
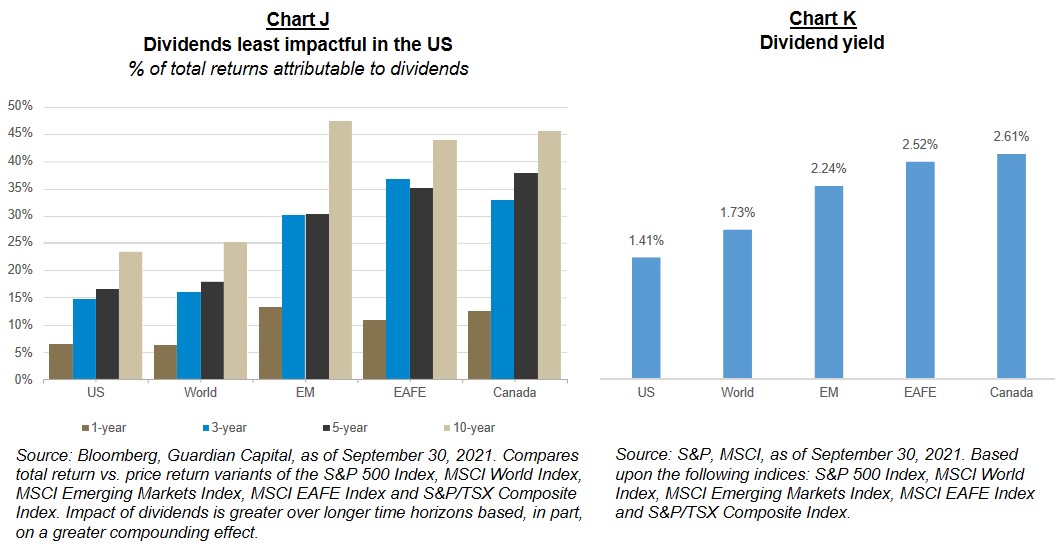
With high-growth, non-dividend paying companies driving returns in the US, it is not surprising to see that dividend-paying stocks in the US and global markets account for a much lower share of total returns than they do in other jurisdictions, like Canada. US-based exposure has provided returns that are overwhelmingly based on stock price appreciation and, as it stands today, dividend yields in the US are amongst the lowest in the world.
The preceding charts may seem to paint a grim picture for dividends, however, the intention is to better understand where we’ve been to help in assessing where we might be going and to level-set expectations for an asset-class that has fallen out of favour with investors who have been more focused on the upside potential of Growth stocks.
We believe that as we transition out of an era of quantitative easing which has propelled Growth stocks higher, dividends could be primed for a comeback and represent an attractive asset class to consider for investors looking for reduced volatility and enhanced income potential in the face of historically low interest rates.
All charts and illustrations in this document are for illustrative purposes only. They are not intended to predict or project investment results. The outlook and opinions expressed in the communication are not to be used or construed as investment advice or as an endorsement or recommendation of any security discussed herein. This information is provided as of the published date and is subject to change without notice. Assumptions, opinions and estimates are provided for illustrative purposes only and are subject to significant limitations. Reliance upon this information is at the sole discretion of the reader. For more information on the financial terms used in this document, please refer to the Glossary of Terms on our website at: https://www.guardiancapital.com/investmentsolutions/glossary-of-terms/.
This document is intended as a general source of information. It is not intended to provide specific individual advice including, without limitation, investment, financial, legal, accounting or tax, and should not be relied upon in that regard. Individuals should seek the advice of professionals, as appropriate, regarding any particular investment. Every effort has been made to ensure that the information contained in this document is accurate at the time of publication, but is subject to change at any time, without notice, and Guardian is under no obligation to update the information contained herein. Certain information contained in this document has been obtained from external sources which Guardian believes to be reliable, however we cannot guarantee its accuracy. This document may not be reproduced or redistributed without the consent of Guardian Capital LP. This information is not intended for distribution into any jurisdiction where such distribution is restricted by law or regulation.
Guardian Capital LP is a wholly-owned subsidiary of Guardian Capital Group Limited, a publicly traded firm, the shares of which are listed on the Toronto Stock Exchange. For further information on Guardian Capital LP and its affiliates, please visit www.guardiancapital.com.