
Partnership with Retirement Expert Moshe A. Milevsky
Exclusive collaboration provides Canadian-based investment advisors access to thought leadership and tools.
The Longevity of Your Nest Egg
In July 2020, Canada turned 153 years old; it had been 53 years since the Maple Leafs won their last Stanley Cup and six months since the beginning of the COVID-19 pandemic. And, although the last one (or even two) of those might feel like it has been much longer, chronological time is an objective and easy-to-measure description of how long something has lasted. To use a related word, longevity is defined as the “length of continuance” and is one of the easiest retirement metrics to explain. For example, stating that the longevity of your retirement might be as long as 30 years is a very common assertion that most people can understand and intuit.
Unfortunately, there are other metrics that are often used in conversations about retirement income planning that aren’t as intuitive, clear or even relevant. In the investment and portfolio management business, you might have heard of words like alpha, beta and other Greek letters that are used to describe the risk and return characteristics of a portfolio or a mutual fund; and while those Greek characters might be relevant to the asset managers themselves, it’s hard to convey their meaning to investors. This is especially true with retirees whose main concern is to ensure their hard-earned money lasts for as long as possible. Do you really care about the VIX when interest rates are at historic lows?
With that in mind, in this note we would like to introduce a concept we label portfolio longevity, and more specifically, discuss an opportunity that aims to extend the longevity of your retirement.
First of all, on a philosophical level, an investment portfolio (basically a collection of stocks and bonds) in the decumulation phase of an individual’s financial lifecycle can be thought of as a living and breathing organism; one with a finite lifespan. Why? Because you aren’t adding money, you are subtracting. This means the money itself has a longevity, no different than a plant, tree or human. Also, while the equation for human longevity depends on many interconnected variables, portfolio longevity is primarily driven by two factors: the stability of your portfolio’s investment return and your spending rate. Withdraw too much or invest inappropriately and the portfolio will collapse faster than the Leafs’ playoff chances.
Let’s start with spending. Imagine you have $100 in your nest egg, and you put it all under your bedroom mattress earning zero percent interest – which is actually what the banks are paying these days! If you withdraw or spend $5 every year from these funds, the longevity of your nest egg is $100/$5 = 20 years. Year one this figure is down to $95, then $90, then $85, and then $0 in year 20. Yet if you withdraw only $4 per year, the longevity is $100/$4 = 25 years.
That’s all nice and well when the money isn’t earning anything. But what happens when the money isn’t under the mattress – or sitting in a bank account – but actually invested and earning some decent returns? Well, if we ratchet up the math just a little bit, there is a relatively simple equation that determines the longevity of your portfolio.¹
“Portfolio longevity is primarily driven by two factors: the stability of your portfolio’s investment return and your spending rate. Withdraw too much or invest inappropriately and the portfolio will collapse.”
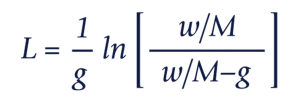
1 In this equation, the letter L (on the left-hand side) represents longevity in years. On the right-hand side, the letter g denotes a real rate of return after taxes and inflation, the letter w is a withdrawal amount in real dollars and M is the sum of money in your nest egg at retirement. Finally, the ln denotes the natural logarithm; which allows you to adjust for compounding. The source for this is described in reference [3] and known as Fibonacci’s equation. Fibonacci’s equation or sequence is one in which each number in the sequence is the sum of the two numbers that precede it.
In this case, the longevity of your nest egg will be extended for a given level of withdrawal. Similar to the example above, if you have $100 in your nest egg and you withdraw or spend $5 every year from these funds, part of this withdrawal amount will be earned from the rate of return obtained on your investments. Suppose you earn a constant 3% from your investments (or $3 in year 1); this would only require you to obtain $2 from your nest egg to meet your $5 withdrawal. For year 2, your investments would cover marginally less than the $3 ($98 * 3% = $2.94) of the $5 annual withdrawal amount which will require the balance ($2.06) to be obtained from the nest egg, lowering the remaining portfolio total to $95.94. This process is repeated year-over-year until the nest egg is completely depleted, which works out to approximately 30.5 years – 10.5 years longer than the mattress example above.
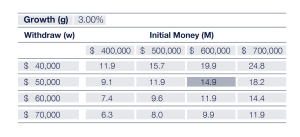
Assuming a hypothetical couple is entitled to a combined $40,000 in CPP/QPP benefits annually – guaranteed for life and adjusted for inflation – in addition to a nest egg or portfolio of $600,000. And assume this money is invested in a diversified portfolio projected to earn a real 3% per year. Now assume this couple would like to withdraw $50,000 every year to satisfy a total income need of $90,000. This couple wants to know: Is this retirement plan sustainable? What is the longevity of the money?
For starters, let’s determine the longevity of their nest egg in a zero interest rate scenario (money under the mattress): $600,000/$50,000 = 12 years. In this case study, the couple’s initial withdrawal rate is 50,000/600,000 = 8.3%, which is a rock-bottom longevity of the nest egg. Assuming the portfolio earns a real 3% return per year, the longevity will increase to approximately 15 years. That’s the key number. In other words, the portfolio will be exhausted within a decade and a half of retirement. But remember, as healthy retirees, this couple may have a longevity of 25 or even 30 years, but their money only has a longevity of 15 years. This is not a good situation. They are withdrawing too much!
Well, here are some questions – if the couple can wait a few years until their nest egg grows to $700,000 (for example) and manage to withdraw only $40,000 per year (for example), the same 3% real return per year will yield a portfolio longevity of 25 years. Now that number is in the same ballpark as human longevity. You have added a decade to their (portfolio’s) life. Good work.
For Illustrative Purposes Only. This example does not represent the results of any investors’ actual retirement portfolio. Actual results of an investor’s portfolio will vary, dependent upon individual facts and circumstances, including the impact of market conditions.
Now, to be crystal clear, the portfolio longevity equation doesn’t guarantee that your portfolio will last for exactly L years, but it can provide a good average estimate. Later, we will discuss how to narrow the range of portfolio longevity (PL). But it will be exactly correct in a universe in which real returns are exactly 3% and withdrawals are constant year-over-year in inflation-adjusted terms. If you don’t like our numbers or assumptions, you can use your favorite economic parameters or equation in footnote [1], and the above table provides some ranges. Either way, the math is transparent and replicable and likely a sobering wake-up call to many retirees. It can even serve as a welcome license to spend a little more if the longevity number is very high.
Once you understand the idea of portfolio longevity – and its range – we can dig just a little bit deeper and investigate how the investment asset allocation affects the dispersion of portfolio longevity.
Think back to the concept of human longevity and the length of time someone is likely to spend in retirement. That number (measured in years) depends on a number of explicit and implicit factors, some of which are totally outside your control. If you are fortunate enough to have great genes and both your parents lived a long time, then you are likely to be blessed with greater human longevity. If you eat healthy, exercise regularly and drink in moderation, that too will increase human longevity. Yet here is a key point: there is a limit to how much that helps, especially if you are endowed with poor pre-existing conditions. Running 50 kilometres a week isn’t likely to keep you alive any longer than if you limit it to five kilometres. Again, the upside to your human longevity is limited, but the downside can be quite steep! Cross the street in the wrong place or at the wrong time and your longevity can quickly go to zero. In other words, longevity is not symmetric in your actions. That should be intuitive.
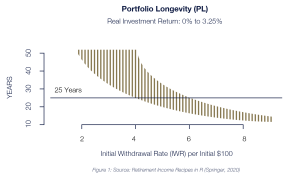
Well, the exact same thing happens with portfolio longevity. There are techniques that aim to limit the downside range of portfolio longevity. The explicit downside protection provided from an options collar strategy seeks to reduce the negative equity market experience. The trade-off is that this options collar strategy will not always keep pace with the equity market when it is rising, but more downside protection means you can afford less upside participation. By reducing the sharp drops in an equity portfolio, the median longevity of that portfolio during an adverse period for decumulation may be extended from 20 years to 26 years.2
The scientific theory of how these sorts of options collars can extend the longevity of a portfolio is well-established and explained in reference [2].
2 Assumes an initial withdrawal rate of 5% of savings, increased at an annual inflation rate of 3% and a 2% annual management fee. For a $100 portfolio, year 1 withdrawal of $5 growing at a rate of 3% per year thereafter.
Methodology:
• Data used in this analysis is based on data pulled from Robert Shiller’s online databases, specifically the public “US Stock Markets 1871-Present and CAPE Ratio” dataset available here: http://www.econ.yale.edu/~shiller/data/ ie_data.xls.
• The equity total return index is calculated based on the monthly S&P 500 price index, with the base set to 100 in January 1918. The assumption is that the dividend is reinvested in the index at the end of every month.
• The bond total return index is calculated based on the monthly US 10-Year Treasury yield, with the base set to 100 in January 1918. The assumption is that the 10-year bond is sold at the end of each month and another 10-year note is then purchased at par; the total return is the sum of the accrued interest (based on the yield at the time of purchase; assumption is coupon paid semi-annually) and capital gains (estimated based on the change in yield from the time of purchase to the sale; yield curve is assumed to be flat at desired time to maturity). Interest rate assumptions for simulated options prices in the US Stock Market: Interpolated US Treasury Yield for 3 mth (1927), 6 mth (1958) and 1-year terms (1959), starting from when the data set was available (in brackets).
• For the period of 2005-2018, options prices were calculated for the simulated returns using the assumptions in the disclaimer provided in the original presentation. Prior to 2005, realized historical volatility was used for the option pricing model.
• The return series was linked for the entire history.
Now that you are aware of the longevity of your portfolio and the implications of withdrawal rates and investment returns, you can look for investment products that incorporate strategies that aim to limit the downside. This may perhaps come at the expense of some upside, but it will allow you to sleep better into your retirement years!
Moshe A. Milevsky, PhD
Chief Retirement Architect
Guardian Capital LP
Moshe A. Milevsky is a well-known thought-leader, speaker, writer and entrepreneur in the field of retirement income planning. In addition to being a lecturer, Moshe is a fellow of the Fields Institute for Research in Mathematical Sciences and a Managing Director of PI Longevity Extension Corp. (PiLECo). He is partnering with Guardian Capital to deliver thought leadership material and tools related to decumulation challenges and to help develop innovative solutions to retirement income problems.
Dino Bourdos, CFA
Head of Investment Solutions
Guardian Capital LP
Dino Bourdos is Head of Investment Solutions and lead portfolio manager of Guardian’s Directed Outcomes strategies. He joined Guardian Capital L.P. in 2018 to build on existing strategies while creating new and innovative investment solutions. Prior to joining Guardian Capital L.P., Dino held the position of Managing Director, Portfolio Management, and was the leader of the Derivatives and Equity Index team at a large Canadian financial institution. He graduated with a BA, Economics from the University of Toronto. He qualified as a CMT through the Market Technician Association, holds the CIM designation and is a CFA Charterholder.