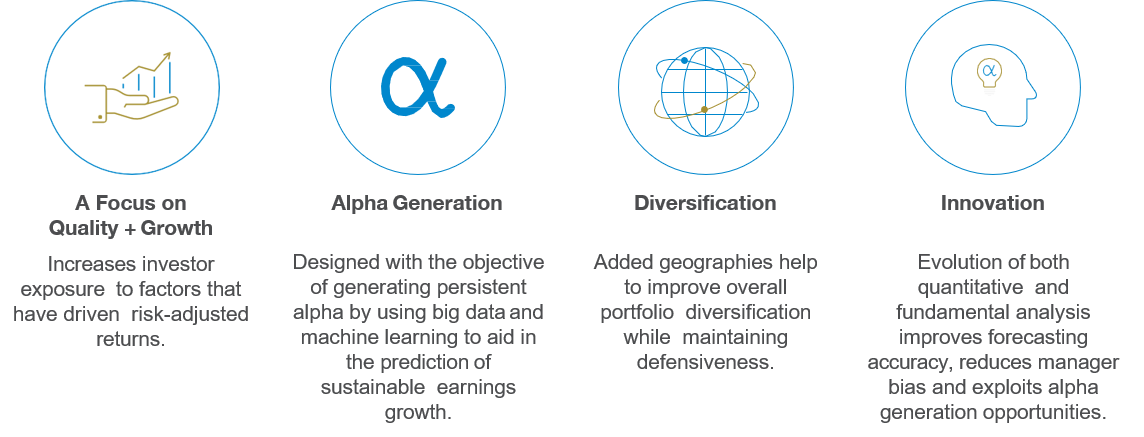
Seeks to create wealth through the investment in companies that provide high-quality sustainable earnings growth
The i³ Investments solutions are focused on delivering risk-adjusted returns and providing investors with building blocks to create sophisticated multi-asset portfolios.
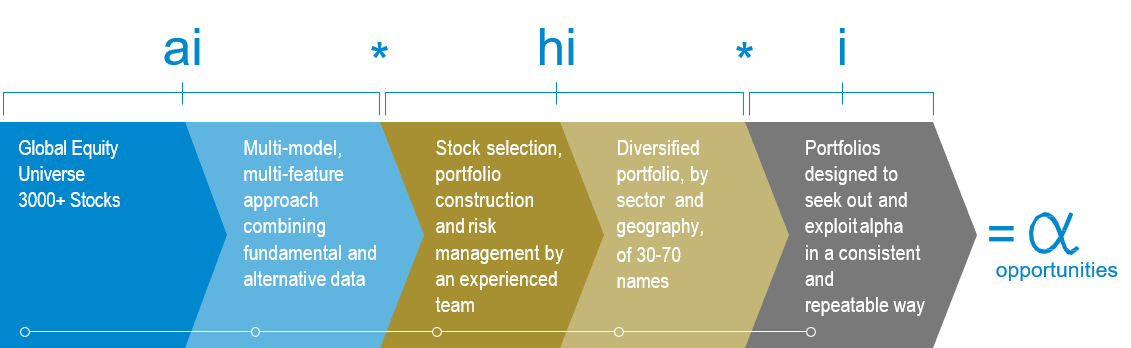
Fusing artificial intelligence (ai), human intelligence (hi) and innovation (i), the i³ Investments team provides a modern approach to portfolio construction.
ai * hi * i = α opportunities
Investors tend to focus on their domestic market. In large and diverse markets, a ‘home’ bias will not pose a problem. In a country such as ours, where we comprise of less than 5% of the capitalization in global equity markets, this type of concentration can have a significant effect on investors’ portfolios.
The Challenge
-32%: The percentage that stock dispersion has dropped from 2009 to 2018, while correlations have increased indicating a sign of strain in the market.1
#1: Canada has the highest concentration of closet index funds in the world, leading to a large number of highly inefficient portfolios.2
44 of 642: Actively managed funds in Canada have outperformed their index over the last 10 years (7%). Alpha is scarce.³
Answering the Challenge
Investment Intelligence Evolved. The i³ Investments approach focuses on delivering differentiated alpha and diversification, seeks to enhance investment outcomes.
Investment Process
Guardian i³ Global Quality Growth ETF uses the i³ Investments process to create a global equity strategy, identifying companies with the highest quality and growth characteristics. The underlying strength of quality companies is their ability to generate consistently solid earnings growth, which helps to insulate them from down market volatility, and to generate alpha opportunities over the longer-term and throughout full market cycles.
An evolved approach to traditional broad investment choices, Guardian i³ Global Quality Growth ETF seeks to invest in the best of future growth themes and the quality companies inhabiting that space.
Access the Solution
Guardian i³ Global Quality Growth ETF
Global equity strategy focused on identifying sustainable earnings growth from high-quality companies.
Ticker: GIQG (Hedged) | GIQG.B (Unhedged)
Management Fee: 0.65%
Using Minds and Machines to Generate Alpha Opportunities
Guardian’s i³ Investments team are innovative and adaptive active managers, striving to deliver sustainable returns to investors. Their process, developed over many years and market cycles, evolved from straightforward quantitative factor driven analysis into today’s innovative world of AI machine learning techniques. The lead portfolio managers are:
Sri Iyer, MBA
Managing Director – Head of i³ Investments
Guardian Capital LP
Fiona Wilson, MBA, CFA
Senior Portfolio Manager – i³ Investments
Guardian Capital LP
1 The Overlooked Persistence of Active Outperformance. Joseph V. Amato, Peter D’Onofrio, Alessandra Rago. March 07, 2019
2 Indexing and Active Fund Management: International Evidence. Martijn Cremers, Miguel A. Ferreira, Pedro Matos, Laura Starks. January 2015
3 SPIVA® Canada Scorecard. S&P Dow Jones Indices. A Division of S&P Global. Berlinda Liu, Phillip Brzenk. Mid-Year 2019
Please read the prospectus before investing. Important information about the Guardian Capital exchange traded fund (“ETF”) is contained in its prospectus. Commissions, trailing commissions, management fees and expenses all may be associated with investments in ETFs. You will usually pay brokerage fees to your dealer if you purchase or sell units of an ETF on the Toronto Stock Exchange (“TSX”). If the units are purchased or sold on the TSX, investors may pay more than the current net asset value when buying units of the ETF and may receive less than the current net asset value when selling them. The indicated rate(s) of return is/are the historical annual compounded total return(s) including changes in unit value and reinvestment of all distributions and does/do not take into account sales, redemption, distribution or optional charges or income taxes payable by any securityholder that would have reduced returns. ETFs are not guaranteed, their values change frequently and past performance may not be repeated. This document is intended as a general source of information. It is not intended to provide specific individual advice including, without limitation, investment, financial, legal, accounting or tax, and should not be relied upon in that regard. Individuals should seek the advice of professionals, as appropriate, regarding any particular investment. Every effort has been made to ensure that the information contained in this document is accurate at the time of publication, but is subject to change at any time, without notice, and Guardian is under no obligation to update the information contained herein. Certain information contained in this document has been obtained from external sources which Guardian believes to be reliable, however we cannot guarantee its accuracy. Guardian Capital LP is the Manager of the Guardian Capital ETFs and is a wholly-owned subsidiary of Guardian Capital Group Limited, a publicly traded firm, the shares of which are listed on the Toronto Stock Exchange. For further information on Guardian Capital LP and its affiliates, please visit www.guardiancapital.com